Concentrations and Absolute Numbers – Introduction
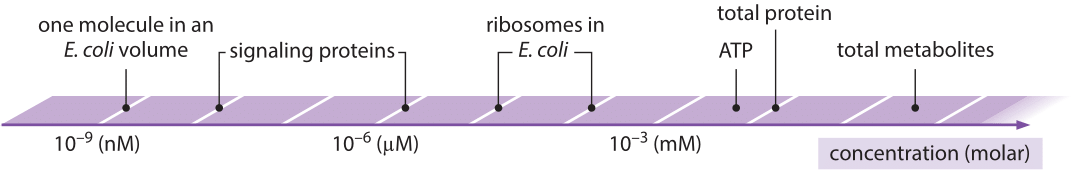
Figure 1: Range of characteristic concentrations of main biological entities from one molecule in a cell to the entire metabolite pool. Wherever an organism is not specified the concentrations are characteristic for most cells in general.
In this chapter, all of our vignettes center in one way or another on the simple question of “how many”. We challenge ourselves to think about critical questions such as how many mRNAs or ribosomes are in a cell, measured in units of absolute number of copies per cell, rather than in relative amounts. These questions are tied in turn to others such as what are the concentrations of ions, metabolites, signaling proteins and other key components such as the molecules of the cytoskeleton, all of which join the molecules of the central dogma as key players in the overall molecular inventory of the cell. In our view, knowing the concentrations and absolute numbers of the biological movers and shakers inside the cell, as depicted in Figure 1, is a prerequisite to being able to progress from qualitative depictions of mechanisms, to constructing models with quantitative predictive power. Before we detail the results of the most advanced molecular techniques for surveying the molecular census of cells, we start with the major energy and matter transformations that sustain life. Today, many high school biology students can recite the stoichiometric equation for carbon fixation in the process of photosynthesis. But in fact, the ability to account for the molecular census in this problem required the invention by the early “pneumochemists”, literally meaning chemists of the air, of new ways of accurately measuring the quantities of different gases taken up and liberated during photosynthesis. Figure 2 shows how these early experimenters positioned leaves underwater and painstakingly measured the volume of so called “pure air” (oxygen) released. Such careful and accurate quantitation was at the heart of revealing and proving the photochemical basis for this secret of life that had earlier garnered metaphysical vitalistic explanations.
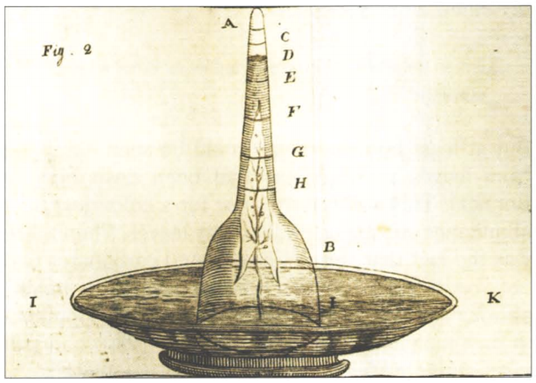
Figure 2: Experimental apparatus developed in order to learn about the gases taken up and liberated by plants. This setup made it possible to quantify the volume of oxygen gas produced by a leaf submerged in water. Many substances were added to the water to investigate their effect on oxygen production. This research effort in the second half of the 18th century, culminated in the discovery that carbon dioxide, available at very low concentrations, is the substrate that plants feed on in the process of photosynthesis. (Adapted from: Farmer, Arch. Sci. 2010, 63:185-192).
Chemistry is all about interactions between atoms and molecules of different types. Paul Ehrlich noted “Corpora non agunt nisi ligata”, meaning “a substance is not effective unless it is linked to another”. One of the tenets of this chapter is the assertion that the propensity to form such linkages depends critically on the concentrations (and affinities) of the binding partners. The familiar case of hemoglobin illustrates the sensitive dependence of the binding of the essential oxygen to this protein. A similar story plays out in the context of DNA and the transcription factors that are in charge of regulation of expression. Probably the most well known example of such a regulator is the repressor protein LacI of lac operon fame. Less well known is the fact that in an E. coli cell this transcription factor has a copy number of order ≈10 tetramers per cell. The reason such a low copy number is interesting is because it immediately raises questions about small-numbers effects which lead to cell-to-cell variability.
Not only do we have to think about the contents within the cell, but similar questions abound in the context of the cell surface, whose “real estate” is in limited supply. The cell surface is riddled with a dense population of different membrane proteins, many of which serve as conduits for communicating information about the external environment to the cell. Here too, the binding between these surface receptors and their ligand partners is a sensitive function of the concentrations of both species. Real estate on the cell surface can limit the absolute number of transporter proteins and we speculate on how it can play a part in putting a speed limit on maximal growth rates. In this chapter we aim to convince the reader that the same basic approach, that pays careful attention to the quantitative abundance of different molecular species, can be repeated again and again for nearly all of the different provinces of molecular and cell biology with great rewards for our intuition of what it means to function as a cell.
Over the course of this chapter, we go beyond taking stock only of molecular quantities by asking other census questions such as what is the concentration of bacterial cells in a saturated culture. One of the reasons this number is interesting and useful is that it tells us something about that most elemental of microbiological processes, namely the growth of cells in a culture tube. If we are to place a single bacterium in a 5 mL culture tube containing growth media with some carbon source, a few hours later, that one cell will have become more than 109 such cells. How have the molecular constituents present in the culture tube been turned into complex living matter and what are the relative concentrations of the proteins, nucleic acids, sugars and lipids that make up these cells? This simple growth experiment serves as one gateway from which to examine the chemical and macromolecular census of various types of cells. Though each cell is different, some handy and general rules of thumb can still be derived. For example, at ≈30% dry mass of which ≈50% is carbon a 1 μm3 cell volume will contain 100-200×10-15 g carbon. Because the molecular mass of carbon is 12 Da this is equivalent to just over 10-14 mol, or by remembering Avogadro’s number, 1010 carbon atoms, a fact already introduced in the opening chapter section on “Rules of thumb”.
Our choice of topics is idiosyncratic rather than comprehensive. One of the motivations for our choices is a desire to see if we can figure out which molecular players are in some sense dominant. That is, what one (or top ten) proteins are the most abundant in some cell type and why? The protein Rubisco, the key for turning inorganic carbon into organic matter in the form of sugars, has sometimes been called the “most abundant protein on Earth” and as such and due to its impact on agricultural productivity, has garnered much interest. We show, however, that this claim about Rubisco is likely exaggerated with other proteins such as the extracellular matrix protein collagen making up about a third of the protein content in humans and livestock coming in at even higher numbers. Similarly, as evidenced by their role in mapping out the diversity of life on Earth, ribosomes are a nearly universal feature of the living world and in rapidly dividing cells are a major cellular component. In different vignettes we interest ourselves in the molecular census of these and other dominant fractions of the biomass of cells, trying to sharpen our intuition about what cells are all about.