How big is an E. coli cell and what is its mass?
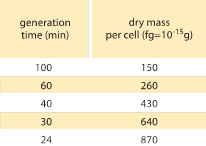
Table 1: Relation between bacterial mass and division time. The dry mass per cell is given as a function of the generation (doubling) time. Mass is suggested to increase roughly exponentially with growth rate as originally observed by M. Schaechter et al J. Gen. Microbiol., 19:592, 1958. The cell dry weight was calculated using a value of 173 µg per OD460 unit of one mL (BNID 106437). Strain used is B/r, a strain commonly used in early bacterial physiology studies. Values taken from F. C. Neidhardt, “Escherichia coli and Salmonella: Cellular and Molecular Biology”, Vol. 1., Chapter 3, ASM Press, 1996.
The size of a typical bacterium such as E. coli serves as a convenient standard ruler for characterizing length scales in molecular and cell biology. A “rule of thumb” based upon generations of light and electron microscopy measurements for the dimensions of an E. coli cell is to assign it a diameter of about ≈1µm, a length of ≈2µm, and a volume of ≈1µm3 (1 fL) (BNID 101788). The shape can be approximated as a spherocylinder, i.e. a cylinder with hemispherical caps. Given the quoted diameter and length we can compute a more refined estimate for the volume of ≈1.3 µm3 (5π/12 to be accurate). The difference between this value and the rule of thumb value quoted above shows the level of inconsistency we live with comfortably when using rules of thumb. One of the simplest routes to an estimate of the mass of a bacterium is to exploit the ≈1 µm3 volume of an E. coli cell and to assume it has the same density as water. This naïve estimate results in another standard value, namely, that a bacterium such as E. coli has a mass of ≈1 pg (pico=10-12). Because most cells are about 2/3rd water (BNID 100044, 105482) and the other components, like proteins, have a characteristic density of about 1.3 times the density of water (BNID 101502, 104272) the conversion from cellular volume to mass is accurate to about 10%.
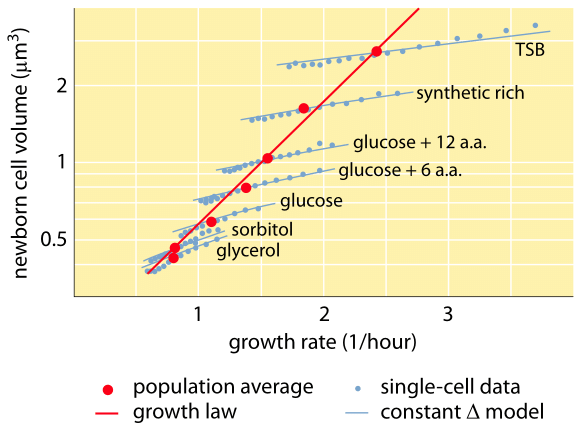
Fig. 1: Relation between cell volume and growth rate. Using microscopy and microfluidic devices cell volume can be measured at the single-cell level under various conditions, confirming that the average cell volume grows exponentially with growth rate. In contrast variation among cells for a given condition scales differently. The variation in single-cell behavior is used to test models of cell size regulation. (Adapted from S. Taheri-Araghi et al., Curr. Biol. 25:385, 2015.)
One of the classic results of bacterial physiology emphasizes that the plasticity in properties of cells derives from the dependence of the cell mass upon growth rate. Stated simply, faster growth rates are associated with larger cells. This observation refers to physiological changes where media that increase the growth rate also yield larger cells as shown in Figure 1. This was also found to hold true genetically where long term experimental evolution studies that led to faster growth rates showed larger cell volumes (BNID 110462). Such observations help us dispel the myth of “the cell” – where people, often unwarily, use measurements about one cell to make inferences about other cell types or the same cell type under different conditions. Classic studies by Dennis and Bremer systematized these measurements and found that dry mass varies as shown in Table 1 from an average value of 148 fg for cells dividing every 100 minutes to 865 fg for those with a 24 minute division time, indicating over a 5-fold difference depending upon the growth rate. A similar trend has been seen in other organisms (e.g. for budding yeast, BNID 105103). At about 70% water these values correspond to a range between about 0.4 to 2.5 µm3 in terms of volume. How can we rationalize the larger sizes for cells growing at faster rates? This question is under debate to this day (Molenaar D. et al. MSB 5:323, 2009; Amir, A., Phys. Rev, Let., 112:208102, 2014). Explanations vary from suggesting it has an advantage in the way resource allocation is done to claiming that it is actually only a side effect of having a built in period of about 60 minutes from the time a cell decides it has accumulated enough mass to begin the preparations for division and until it finishes DNA replication and the act of division. This roughly constant “delay” period leads to an exponential dependence of the average cell mass on the growth rate in this line of reasoning (Amir, A., Phys. Rev, Let., 112:208102, 2014).
Methods to measure cell volume range from the use of a Coulter Counter ((BNID 100004), which infers volume based on changes in resistance of a small orifice as a cell passes in it, to more direct measurements using fluorescence microscopy that gauge cell lengths and diameters under different conditions (Figure 1 and BNID 106577, 111480). Surprisingly, the fact that different laboratories do not always converge on the same values may be due to differences in calibration methods or exact strains and growth conditions. An unprecedented ability to measure cell mass is achieved by effectively weighing cells on a microscopic cantilever. As illustrated in Figure 2A, fluid flow is used to force a cell back and forth in the hollowed out cantilever. The measurement exploits the fact that the cell mass affects the oscillation frequency of the cantilever. This frequency can be measured to a phenomenal accuracy and used to infer masses with femtogram precision. By changing the liquid flow direction, the cell is trapped for minutes or more and its mass accumulation rate is measured continuously at the single-cell level. In the initial application of this technique it was shown that single cells which are larger also accumulate mass faster, shedding light on a long standing question: is cell growth linear with time or more appropriately described by an approximately exponential trend? The differences can be minute but with these revolutionary capabilities it was clearly seen that the latter scenario better represents the situation in several cell types tested as shown in Figure 2B.
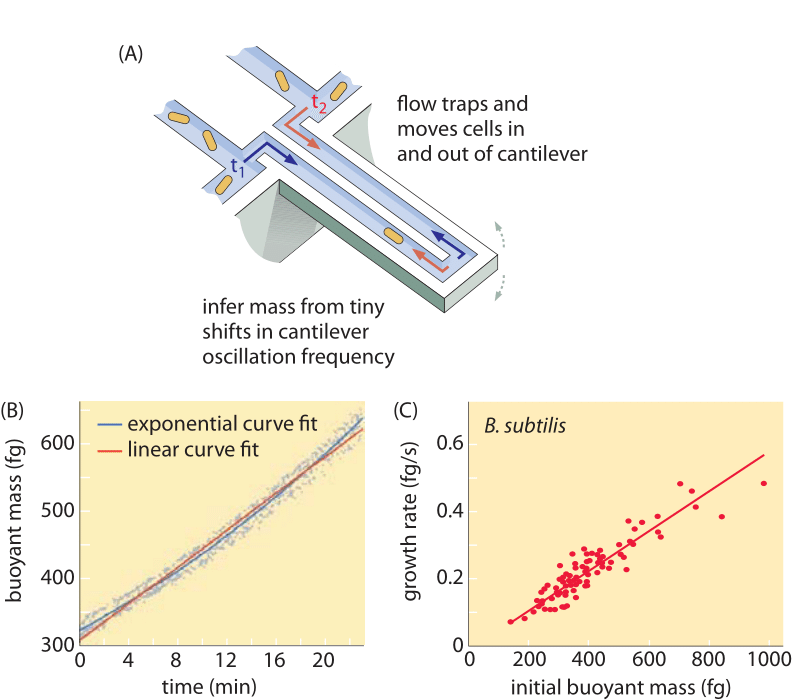
Fig. 2: Using buoyant mass to measure the growth of single cells. (A) A micron-scale cantilever oscillates at high frequency and the mass of cells can be determined from changes in the oscillation frequency. (B) Measured over time, this results in a single cell mass accumulation curve as shown. (C) Shown here are B. subtilis cells. A comparison between the predictions of linear and exponential growth models are shown as best fits. The similarity demonstrates how close the two models are over a range of only two-fold increase over the course of the cell cycle. Cell dry weight is about 4 times the buoyant mass. (Adapted from M. Godin et al., Nature Meth. 7:387, 2010.)