How big is the endoplasmic reticulum of cells?
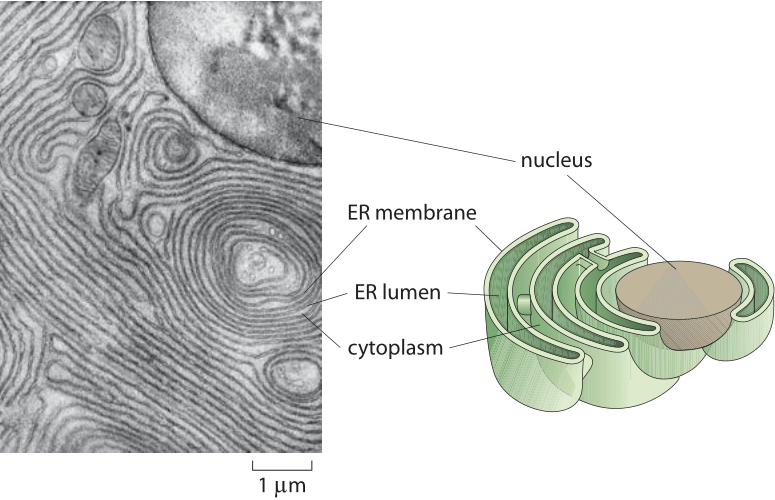
Figure 1: Structure of the endoplasmic reticulum. The left panel shows a thin-section electron micrograph of the region surrounding the nucleus in an acinar cell that comes from the pancreas of a bat. The schematic illustrates the connected membrane morphology of the ER which is contiguous with the nuclear membrane. (The electron micrograph is adapted from D. W. Fawcett, The Cell, Its Organelles and Inclusions: An Atlas of Fine Structure, W. B. Saunders, 1966.)
The endoplasmic reticulum, known to its friends as the ER, is often the largest organelle in eukaryotic cells. As shown in Figure 1, the structure of the ER is made up of a single, continuous membrane system, often spreading its cisternae and tubules across the entire cytoplasm. In addition to its exquisite and beautiful structure, it serves as a vast processing unit for proteins, with ≈20-30% of all cellular proteins passing through it as part of their maturation process (BNID 109219). As another indication of the challenge faced by the ER we note that a mature secreting B cell can secrete up to its own weight in antibody each day (BNID 110220), all in need to first be processed in the ER. The ER is also noted for producing most of the lipids that make up the cell’s membranes. Finally, the ER is the main calcium deposit site in the cell, thus functioning as the crossroads for various intracellular signaling pathways. Serving as the equivalent of a corporate mailroom, the ER activity and thus size depends on the state of the cell.
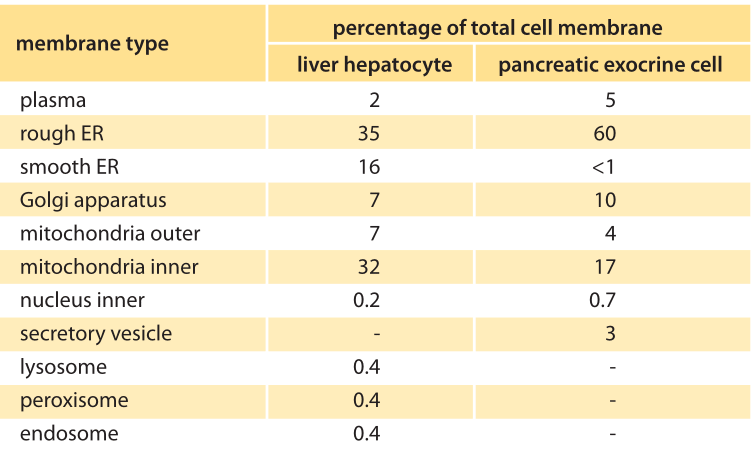
Table 1: The percentage of the total cell membrane of each membrane type in two model cells. The symbol ‘-‘ indicates that the value was not determined. Adapted from MBOC, 5th ed.. Table 12-1.
When talking about the “size” of organelles such as the ER, there are several different ways we can characterize their spatial extent. One perspective is to compare the total membrane area tied up in the organelle of interest relative to that of the plasma membrane, for example. A second way of characterizing the spatial extent of the organelle is by appealing to the volume enclosed within the organelle of interest and comparing it to the total cell volume. As can be inferred from the electron micrograph image of an acinar cell from the pancreas in charge of secretion (Figure 1), the undulating shape of the convoluted endoplasmic reticulum membrane ensures that its surface area is actually 10-20 times larger than the outer surface area of the cell itself (the plasma membrane). The distribution of membrane surface area among different organelles in liver and pancreatic cells is quantitatively detailed in Table 1. The table shows that the membrane area allocation is dominated by the ER (as much as 60%) followed by the Golgi and mitochondria. The cell plasma membrane in these mammalian cells tends to be a small fraction of less than 10%. In terms of volume, the ER can comprise >10% of the cellular volume as shown in Table 2.
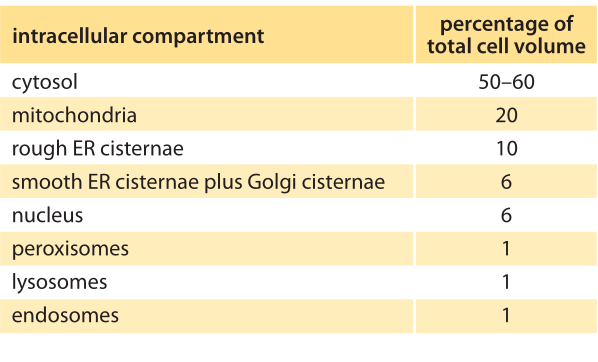
Table 2: The volume fraction occupied by different intracellular compartments in a liver hepatocyte cell. Adapted from MBOC, 5th ed. p. 697.Table 12-2.
In recent years, the advent of both fluorescence microscopy and tomographic methods in electron microscopy have made it possible to construct a much more faithful view of the full three-dimensional structure of these organelles. One of the insights to emerge from these studies is the recognition that they are made up from a few fundamental structural units, namely, tubules which are 30-100 nm in diameter (BNID 105175, 111388) and sheets which bound an internal space known as the ER lumen as shown in Figure 1. As with studies of other organelles such as the mitochondria, early electron microscopy images were ambiguous since in cross section, even planar cisternae have a tubular appearance. The more recent three-dimensional membrane reconstructions have clarified such issues by making it possible to actually see tubular structures unequivocally and to avoid mistaking them with cuts through planar structures. These more detailed studies have revealed that the ER’s fundamental structures are spatially organized with the sheets being predominant in the perinuclear ER and tubules found primarily at the peripheral ER. Thus, it appears that the various parts of the cell “sees” different ER architecture. The ER is in contact with most organelles through membrane contact sites. For example, the mitochondria-ER contact site is composed of a complex of membrane proteins that span either organelle. Similar contacts are found between the ER and the vacuole, peroxisome and cell membrane.
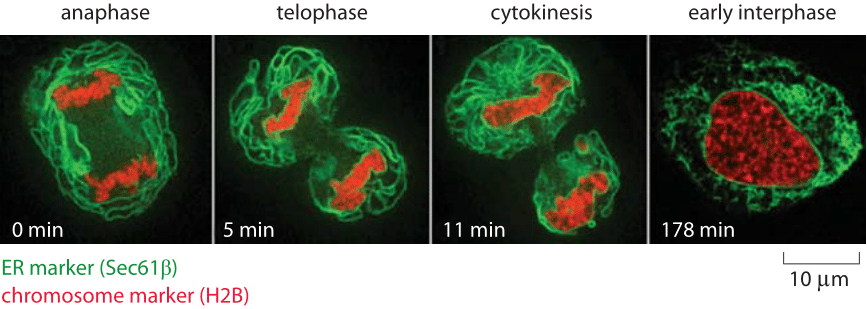
Figure 2: Structural dynamics of the endoplasmic reticulum during the cell cycle. Confocal images of HeLa cells. The chromosomes are labeled in red using a fusion of a fluorescent protein with histone H2B. The ER is labeled in green by virtue of a fusion to a molecular member of the ER segregation apparatus (Sec61-GFP). The sequence of images shows the changes in ER morphology as a function of time during the cell cycle. (Adapted from L. Lu et al., Molecular Biology of the Cell 20:3471, 2009).
Of course, one of the deceiving aspects of images like those shown in Figure 1 is that they give the illusion that these structures are static. However, given the cell’s imperative to reproduce itself, it is clear that during the process of cell division when the nuclear envelope dissolves away, the ER must undergo substantial rearrangement as well, cutting it in two parts to later re-engulf the two nuclei to be. Beautiful recent studies have made it possible to watch the remodeling of the endoplasmic reticulum structure during the cell cycle in real time as shown in Figure 2. By making a stack of closely spaced confocal images, it is possible to gain insights into the three-dimensional structure of the organelle over time. In these images, we see that during interphase the ER is reticular (net like). To appreciate the tangled arrangement of organellar membranes even more deeply, Figure 3 provides a reconstructed image using x-ray microscopy of the ER and other ubiquitous membrane systems in the cell. In this cell type and growth conditions the reconstruction reveals that the mitochondria and lysosomes are more dominant in terms of volume than the ER. The cytoplasm itself occupies more than half of the volume even if it is deemed transparent is these reconstructions that take a wide slice (depth of focus) and project it into a dense 2D image. Structural images like these serve as a jumping off point for tackling the utterly mysterious microscopic underpinnings for how the many complex membrane structures of the ER and other organelles are set up and change during the course of the cell cycle.
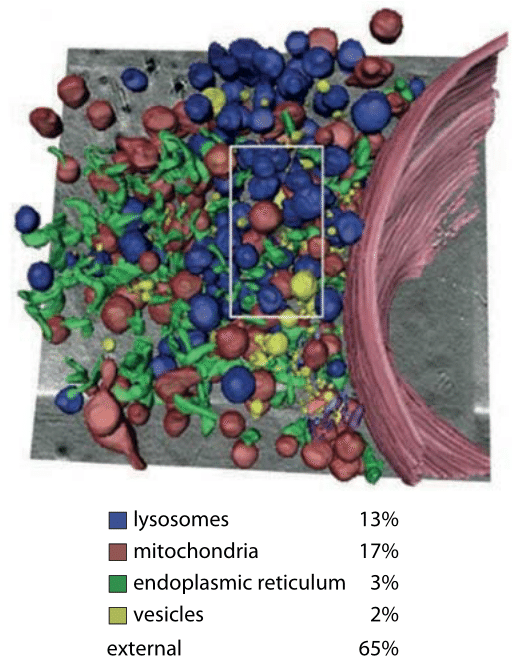
Figure 3: X-ray microscopy images of cellular ultrastructure highlighting the endoplasmic reticulum. This image is a volumetric rendering of images of a mouse adenocarcinoma cell. The numbers represent percent of the volume occupied by the different compartments. (Adapted from G. Schneider et al., Nat. Methods, 7:985, 2010.)