How does metabolic rate scale with size?
When one arrives at biology from its sister disciplines of physics or engineering there is a strong temptation to search for consistent quantitative trends and general rules. One such pursuit centers on the power consumption of different organisms, the so-called metabolic energy consumption rate. This example illustrates how scaling arguments work. For many inanimate systems the energy produced has to be removed through the bounding surface area, and each unit of area allows a constant energy flux. The scaling of surface area, A, with the radius, R, goes as A~R2. At the same time the volume, V, scales as R3. Assuming constant density this will also be the scaling of the total mass, M. The surface area thus scales as A~M2/3. How should the energy production per unit mass, B/M, scale? According to our assumption above, the energy is removed through the surface at a constant rate, and thus the total energy produced should be proportional to A, i.e. B~A. Dividing both sides by M and plugging in the scaling of A with M we finally get B/M~A/M~M2/3/M~M-1/3. Does this simple scaling result based on simple considerations of energy transfer also hold for biological systems?
The resting energy demand of organisms has recently been compared among more than 3000 different organisms spanning over 20 orders of magnitude in mass (!) and of all forms of life. In contrast to the Kleiber law prediction, this recent work found a relatively small range of variation with the vast majority of organisms having power requirements lying between 0.3-9 W/kg wet weight as shown in Figure 2. Our naïve estimate for a human of 1 W/kg wet weight is somewhere in the middle of this, but the surprising observation is that this range is claimed to also hold for minute bacteria, plant leaves and across the many diverse branches of the tree of life all the way to elephants. Is this again an indication of Monod’s adage that what is true for E. coli is true for the elephant? Further evidence for breaking of Kleiber scaling was provided recently for protists and prokaryotes (J. P. Delong et al., Proc. Natl. Acad. Sci., 107:12941, 2010). Other recent studies stand behind Kleiber’s law and aim to explain it. We are not in a position to comment on who is right in this debate, but we are of the opinion that such a bird’s eye view of the energetics of life, provides a very useful window on the overarching costs of running the cellular economy.
The metabolic rate of an organism is condition dependent, and thus should be strictly defined if one wants to make an honest comparison across organisms. The most extreme example we are aware of is that bees in flight increase their oxygen consumption and thus their energy consumption by about 1000-fold in comparison to resting conditions (BNID 110031). Similarly, humans taking part in the strenuous Tour de France consume close to 10,000 kcal a day, about five times the normal resting value. It is most common to refer to the resting metabolic rate, which operationally means the animal is not especially active but well fed. As the alert reader can imagine, it is not easy to ensure rest for all animals, think of an orca (killer whale) as one example. The values themselves are often calculated from the energy consumption rate that is roughly equal to the energy production rate, or in other cases from the oxygen consumption.
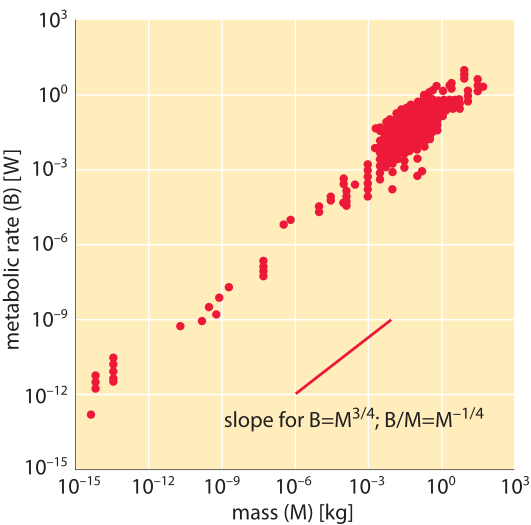
Based on empirical measurements for animals, an observation termed Kleiber’s law suggests a relationship between the resting metabolic energy requirement per unit mass (B/M) and the total body mass (M) that scales as M-1/4. A famous illustration representing this relationship is shown in Figure 1. Similar to the scaling based on surface area and energy transfer described above, the Kleiber law suggests that heavier animals require less energy per unit mass, but with the value of the scaling exponent being slightly different from the value of -1/3 hypothesized above. The difference between -0.33 and -0.25 is not large but the law suggests that the data is accurate enough to make such distinctions. Over the years, several models have been put forward to rationalize why the scaling is different from that expected based on surface area. Most prominent are models that discuss the rate of energy supply in hierarchical networks, such as blood vessels in our body, which supply the oxygen required for energy production in respiration. To give a sense of what this scaling would predict, in moving from a human of 100 kg consuming 100 W, i.e. 1 W/kg, to a mouse of 10 g (4 orders of magnitude), would entail an increase of (10-4)-1/4=10 fold, i.e. to 10 W/kg. Jumping as far as a bacterium of mass 10-15 kg is 17 orders of magnitude away from a human which would entail (10-17)-1/4~104 fold increase or 10,000 W/kg. This is 1-3 orders of magnitude higher than the values discussed in the closely related and complementary vignette on “What is the power consumption of a cell?”. But as can be appreciated in Figure 1, the curve that refers to unicellular organisms is displaced in comparison to the curves depicting mammals by about that amount.
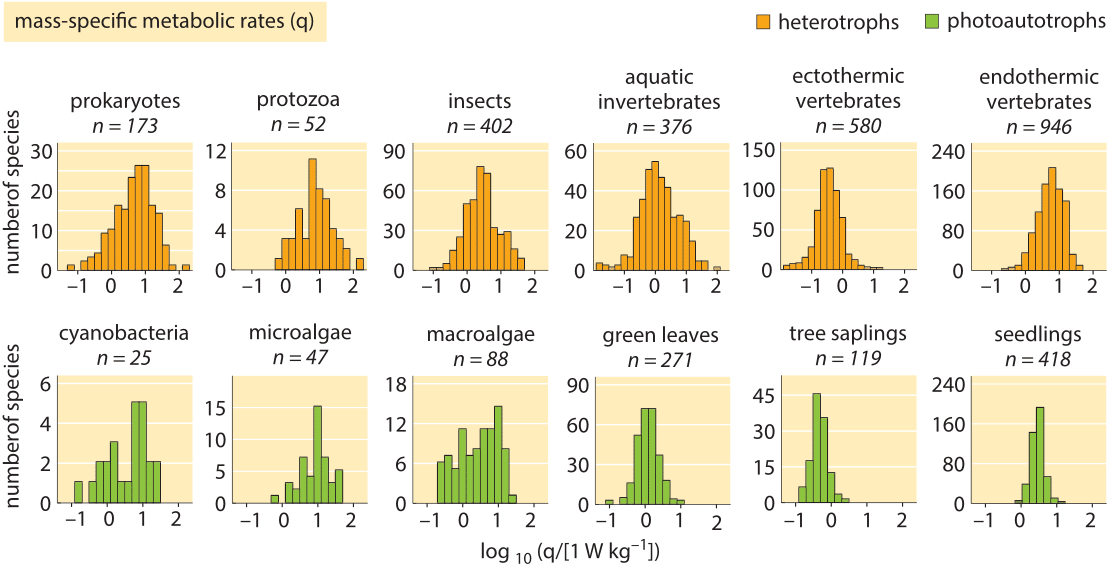
Figure 2: Histograms of resting metabolic rates normalized to wet weight. Across many orders of magnitudes of body size and widely differing phylogenetic groups the rates are very similar at about 0.3-9 W/kg wet weight. (Adapted from A. M. Makarieva, Proc. Nat. Acad. Sci., 105:16994, 2008.)
The resting energy demand of organisms has recently been compared among more than 3000 different organisms spanning over 20 orders of magnitude in mass (!) and of all forms of life. In contrast to the Kleiber law prediction, this recent work found a relatively small range of variation with the vast majority of organisms having power requirements lying between 0.3-9 W/kg wet weight as shown in Figure 2. Our naïve estimate for a human of 1 W/kg wet weight is somewhere in the middle of this, but the surprising observation is that this range is claimed to also hold for minute bacteria, plant leaves and across the many diverse branches of the tree of life all the way to elephants. Is this again an indication of Monod’s adage that what is true for E. coli is true for the elephant? Further evidence for breaking of Kleiber scaling was provided recently for protists and prokaryotes (J. P. Delong et al., Proc. Natl. Acad. Sci., 107:12941, 2010). Other recent studies stand behind Kleiber’s law and aim to explain it.
We are not in a position to comment on who is right in this debate, but we are of the opinion that such a bird’s eye view of the energetics of life, provides a very useful window on the overarching costs of running the cellular economy.