How does temperature affect rates and affinities?
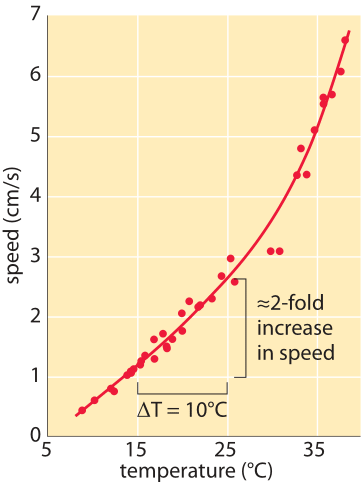
Figure 1: Speed of ants as a function of temperature. Measured by the physicist Harlow Shapley on Mount Wilson above Los Angeles, where he was deeply engaged in measuring the size of our galaxy. The Liometopumapiculatum ants he studied on the mountain have the advantage of being active both day and night thus allowing a larger temperature range to be studied. It was verified that ant body mass had a negligible effect. Similarly there was no significant difference between incoming and outgoing direction on ant speed. (Adapted from H. Shapley, Proc. Nat. Acad. Sci. 6, 204 (1920).)
In the early 1900s, when Harlow Shapley was not measuring the size of our galaxy using the telescope on Mount Wilson, he spent his time measuring how fast ants moved and how their speed depends upon the temperature. His observations are shown in Figure 1 which demonstrates a rapid increase of speed with temperature with about a 2 fold increase as the temperature rises from 15oC to 25oC with another doubling in speed as the temperature rises another 10 degrees from 25oC to 35oC. This relates to an interesting rule of thumb used by enzymologists that states that the catalytic rates of enzymes double when subjected to a 10oC increase in temperature. Though there are many exceptions to this “rule”, what is the basis for such an assertion in the first place? A simplified mental picture of enzyme catalysis argues that there is a free-energy barrier that the substrates have to overcome before they can be transformed to products. For a barrier of “height” Ea where Ea is the Arrhenius energy of activation, the rate scales according to the empirical Arrhenius relationship in which the rate is proportional to exp(-Ea/kBT). The theoretical underpinnings of this result come from an appeal to the Boltzmann distribution. If Ea is very large, the barrier is high and the exponential dependence results in a very slow rate. Many reactions have values of Ea of ≈50 kJ/mol ≈20 kBT (e.g. BNID 107803). In the back of the envelope calculation shown in Figure 2 we show how this suggests that a 10oC (Celsius or Kelvin) change around room temperature results in ≈2 fold change in rate.
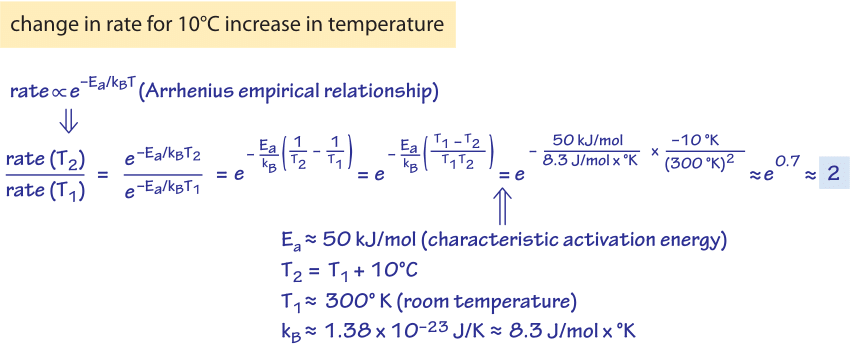
Figure 2: Back of the envelope calculation of the effect of temperature on enzymatic rate. For the estimate given here, the barrier height is taken as ≈60 kJ/mol ≈20 kBT. The effect is computed for a change of temperature of 10OC.
This rate factor which can be independently measured for different reactions is quantified in the literature by a quantity termed Q10 which reveals the factor by which the rate changes for a 10oC change in temperature. Should an increase in temperature increase or decrease the rate at which some reaction occurs? The Boltzmann distribution states that the number of molecules that have energy that suffices to overcome the barrier scales as the exponent of the ratio -Ea/kBT. At higher temperatures the ratio is closer to zero and thus more molecules have the required activation energy which makes the barrier easier to overcome, resulting in an increase in the reaction rate.
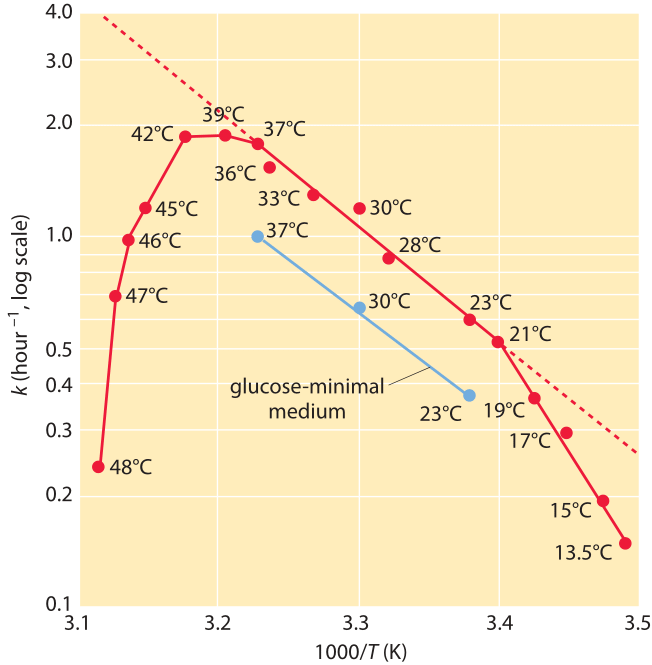
Figure 3: Dependence of the growth rate of E. coli on temperature. The growth rate is plotted versus the inverse of the temperature (an Arrhenius plot). Note the middle range where the dependence looks linear in accordance with Arrhenius rate law. (Adapted from Microbe, M. Schaechter et al., ASM press, 2006 p.63.)
Interestingly, the growth of a whole bacterium also tends to scale with temperature according to a similar functional form (BNID 100919), i.e. log of the growth rate scaling linearly with the inverse temperature below and near the physiological temperature. As an example, growth of E. coli increases by ≈2.5 fold when moving from 17oC to 27oC and then again from 27oC to 37oC. This is often depicted by plotting the growth rate versus 1/T as shown in Figure 3. In this range one can infer an effective value for Ea of ≈60 kJ/mol ≈25 kBT. This is termed an effective value as there is no single barrier that the bacterium has to overcome in order to grow and divide but instead the set of all barriers and processes coalesces into this one effective value.
Though the Arrhenius equation is a staple ingredient of undergraduate education in many disciplines and seems like the obvious choice for characterizing the temperature dependence of biochemical rates, it wasn’t always deemed so simple. A menagerie of functional relationships between rate and temperature were suggested over the years and are summarized in Table 1. As the range of temperatures over which experimental measurements were made only covered a small temperature regime compared to room temperature, most of these different expressions gave similarly good fits. The famed chemist Ostwald stated that temperature dependence “is one of the darkest chapters in chemical mechanics”. Many lessons on the balance of models and experiments can be gleaned from following its history as depicted in a careful review (K. J. Laidler, J. Chem. Edu., 61:494, 1984).
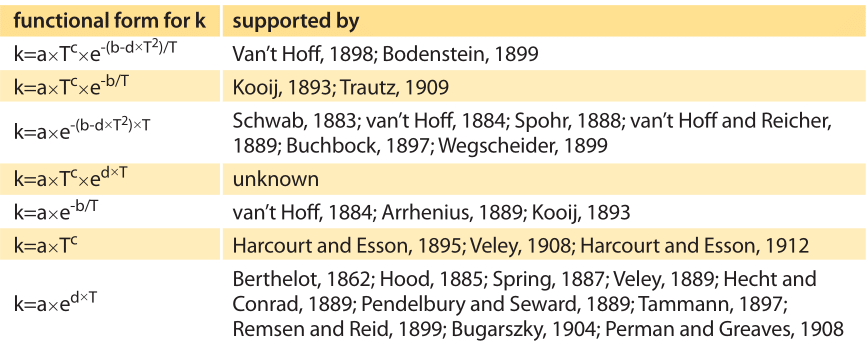
Table 1: Different expressions suggested for the dependence of the rate of a chemical reaction as a function of temperature. Adapted from “The Development of the Arrhenius Equation” Keith J. Laidler, JCE, 1984