How fast do proteasomes degrade proteins?
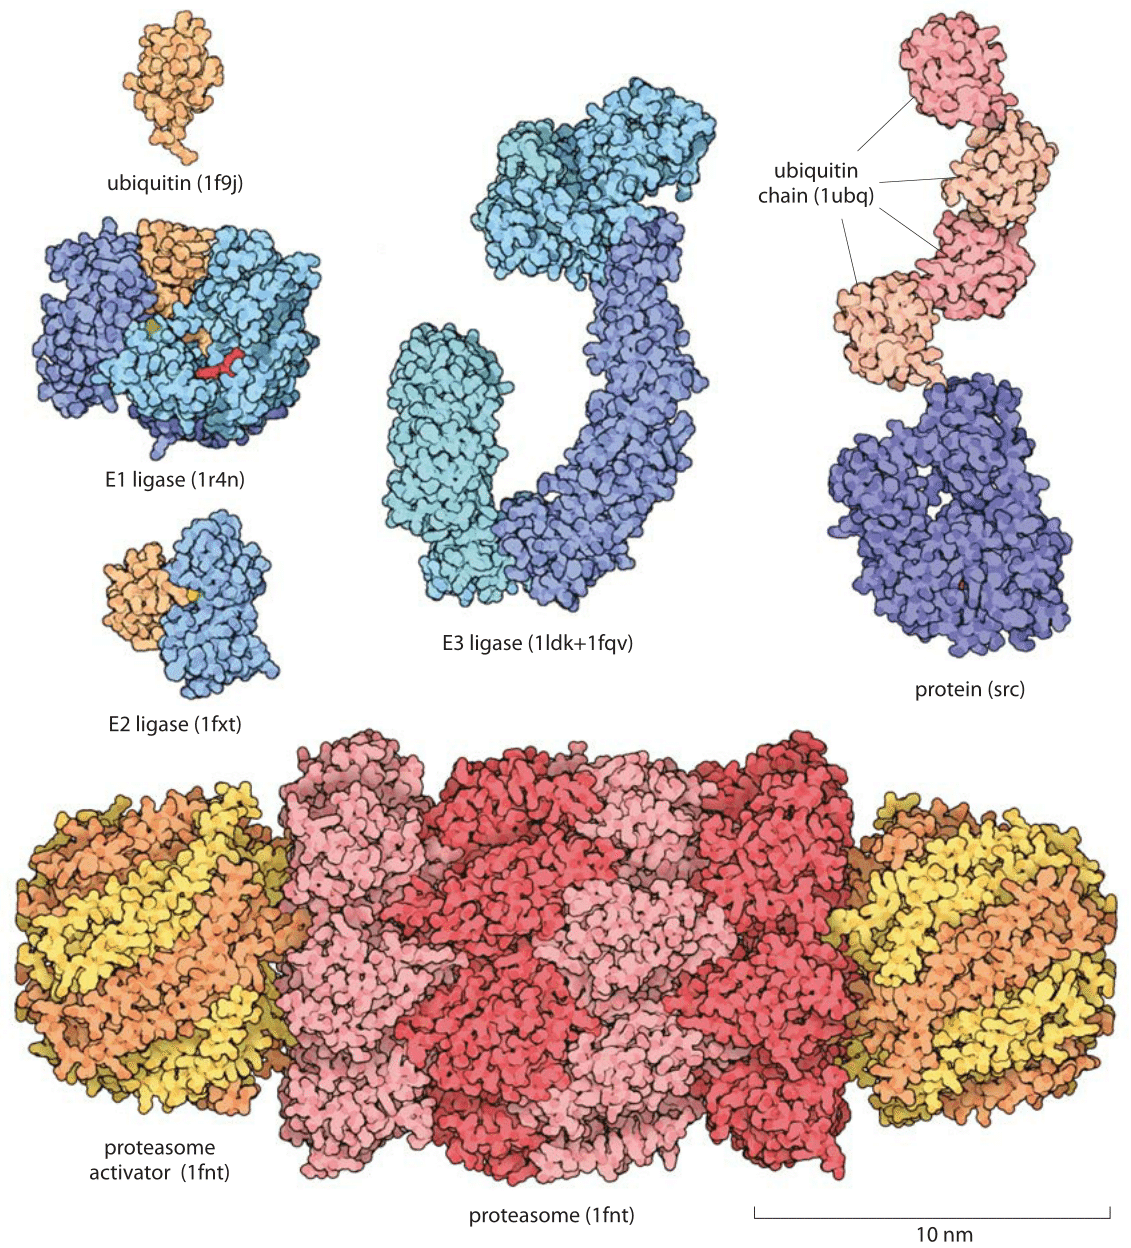
Figure 1: Proteins involved in the Ubiquitin-proteasome pathway for protein degradation. Key molecules in the degradation process range from the ubiquitin molecular tag that marks a protein for degradation to the ligases that put these molecular tags on their protein targets. Once proteins are targeted for degradation, the proteasome actively carries out this degradation. The depicted proteasome is based on the structure determined for budding yeast.
One of the ways in which the protein content of the cell is controlled is by the regulated degradation of its proteins. The main macromolecular machine in charge of degradation is the proteasome. It can be thought of as the “evil” twin of the ribosome. The size and shape of this barrel-shaped machine is seen in Figure 1. What fraction of the proteome is made up of these machines? In HeLa cells about 1% of the total bulk protein was reported to be proteasomes (BNID 108028, 108717). This is far less than the investment in ribosomes which can be as high as a third of the proteome in fast growing bacteria and often 5-10% in other cells (http://www.proteomaps.net/), still a much larger fraction than that taken up by proteasomes. In blood cells, the fraction of proteasomes out of the proteome varies between 0.01-0.3% for different cell types (BNID 108041). The half-life of these machines is found to be about 5 days (BNID 108031). The degradation rate associated with proteasome-mediated degradation is currently based on in-vitro measurements. These rates exhibit a great deal of variability with rates coming in with values from ≈0.05 through ≈0.2 to ≈5 “characteristic” peptide chains per minute (BNID 108032, 109854). Given this wide range of values, we are faced with the key question of whether there is any reason to favor one of these numbers as a “characteristic” value over the others, at least for the rates observed in cell lines studied in the lab? The rate of degradation by the proteasome can vary as a function of the protein substrate and hence the limited aim of a “characteristic” average value. Based on relatively meager information we can try a sanity check. For example, we can ask are there enough molecular machines for degrading a significant fraction of the proteome at each of these rates? As will be seen below, in carrying out this sanity check, which is one of the main mantras of the entire book, one of these results is more plausible than the others.
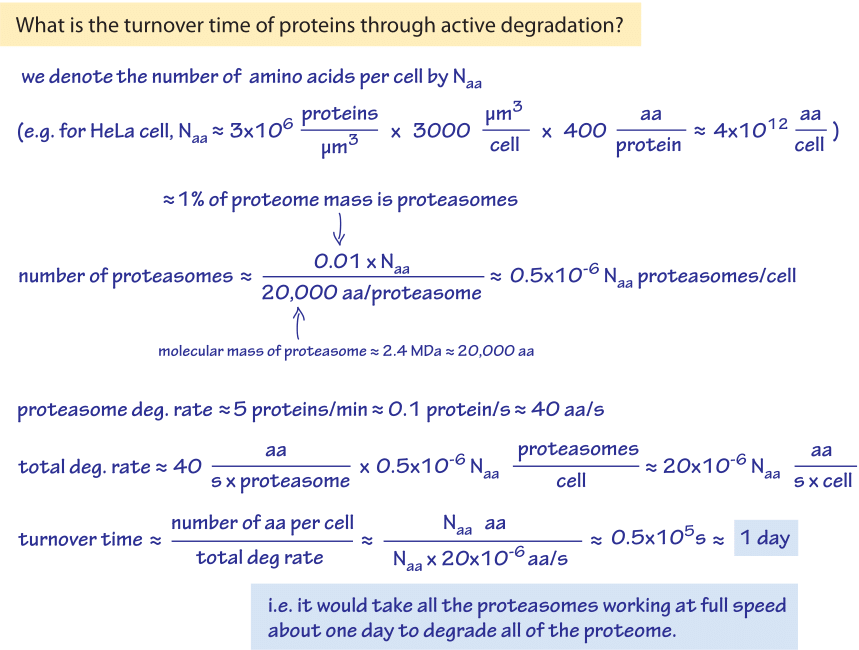
Figure 2: Back of the envelope calculation showing how the overall turnover rate by proteasomes in a HeLa cell is limited to about once a day by the number and rate of proteasomes in the cell.
Assume that the proteome consists overall of Naa amino-acids as shown in Figure 2. For example if there are 3 million proteins in the relevant HeLa cell of 3000 μm3 and the average length is 400 amino acids per protein then Naa is 4×10¹² aa. As we shall see though, the exact value of Naa will cancel in our estimate. Assuming ≈1% of the proteome is proteasomes, we have 0.01Naa amino acids present in those machines. The average molecular weight of a proteasome is ≈2.4×10⁶ Da (BNID 104915) i.e. about 20,000 amino acids. So there are about (0.01xNaa aa)/(20,000 aa/proteasome) ≈0.5×10⁻⁶ Naa proteasomes in the cell (i.e. on the order of a million proteasomes in the Hela cell considered above). Taking the higher rate of proteasome degradation from above of 5 protein/min ≈ 0.1 protein/s we find that on an amino acid basis this degradation rate is equivalent to ≈40 aa/s (though the protein is degraded by the proteasome to chunks of 2-30 amino acids each (BNID 108111) that are only later further degraded by peptidases, so the aa/s unit is only an effective value for easy calculation and comparison and not the actual biophysical process taking place). We note that the rate of protein polymerization by the ribosome (≈10 aa/s, as discussed in the vignette on “What is faster transcription or translation?”) is not very far from this rate of degradation by the proteasome. The two machine complexes also share a similar molecular weight. Focusing back on our sanity check, we thus have an overall degradation rate of (40 s-1)x(0.5×10-6 Naa aa)=20×10-6 Naa aa/s. So the turnover time, which is the total number of amino acids divided by the overall degradation rate is about Naa aa / 20×10-6 Naa aa/s ≈ 0.5×10⁵ s, or about a day. This time scale is about the same as the characteristic cell cycle time for a happily dividing cell line. As is seen in Figure 2, the value of Naa is of no importance for this estimate. This is in agreement with the observations detailed in the vignette on “How fast do RNAs and proteins degrade?” that for cell lines an average protein degradation rate of 1-2 days was measured (BNID 109937). Had we taken the lower limit value on the degradation rate we would have found a turnover time of about a month, way longer than the measured value for fast dividing cells but probably more relevant for cells in our body that turnover slowly, indicating an inclination to trust the rate of 5 peptide chains per minute as the more reliable measurement for fast dividing cells. This is but one example of how a simple calculation can help us perform a sanity check contrasting measured values.