How fast do RNAs and proteins degrade?
The central dogma focuses on the production of the great nucleic acid and protein polymers of biology. However, the control and maintenance of the functions of the cell depends upon more than just synthesis of new molecules. Degradation is another key process in the lives of the macromolecules of the cell and is itself tightly controlled. Indeed, in the simplest model of mRNA production, the dynamics of the average level of mRNA is given by
![]()
where r is the rate of mRNA production and γ is the rate constant dictating mRNA decay. The steady-state value of the mRNA is given by
![]()
showing that to first approximation, it is the balance of the processes of production and decay that controls the steady-state levels of these molecules. If our equation is for the copy number of molecules per cell, there will be an abrupt change in the number each time the cells divide since the total mRNA and protein content is partitioned between the two daughter cells. If instead our equation is thought of in the language of concentrations, we do not have to face this problem because as the cell grows, so too does the number of molecules and hence the concentration varies smoothly. The growth effect on concentration can be absorbed into the rate constant for degradation to take account of the dilution. This is a common mathematically elegant solution but not immediately intuitive, and so we will try to clarify it below. But first, what are the characteristic values for mRNA and protein degradation times?
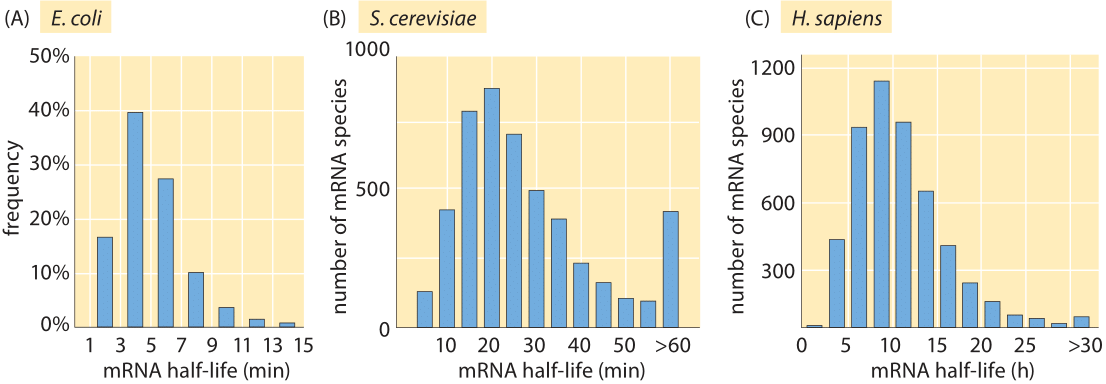
Figure 1: Measured half lives of mRNAs in E. coli, budding yeast and mouse NIH3T3 fibroblasts. (A, adapted from J. A. Bernstein et al., Proc. Natl Acad. Sci. USA 99:9697, 2002; B, adapted from Y. Wang et al., Proc. Natl Acad. Sci. USA 99:5860, 2002; C. adapted from B. Schwanhausser, Nature, 473:337, 2013).
The lifetime of mRNA molecules is usually short in comparison with the fundamental time scale of cell biology defined by the time between cell divisions. As shown in Figure 1A, for E. coli, the majority of mRNA molecules have lifetimes between 3 and 8 minutes. The experiments leading to these results were performed by inhibiting transcription through the use of the drug rifampicin that interacts with the RNA polymerase and then querying the cells for their mRNA levels in two minute intervals after drug treatment. In particular, the RNA levels were quantified by hybridizing with complementary DNAs on a microarray and measuring the relative levels of fluorescence at different time points. These degradation times are only several times longer than the minimal time required for transcriptional and translational elongation as discussed in the vignette on “What is faster, transcription or translation?”. This reflects the fleeting existence of some mRNA messages.
Given such genome-wide data, various hypotheses can be explored for the mechanistic underpinnings of the observed lifetimes. For example, is there a correlation between the abundance of certain messages and their decay rate? Are there secondary structure motifs or sequence motifs that confer differences in the decay rates? One of the big surprises of the measurements leading to Figure 1A is that none of the conventional wisdom on the origins of mRNA lifetime was found to be consistent with the data, which revealed no clear correlation with secondary structure, message abundance or growth rate.

Figure 2: L’éléphant et l’Escheria Coli, décembre 1972. “Tout ce qui est vrai pour le Colibacille est vrai pour l’éléphant”, or in English “What is true for the E. coli is true for the elephant”. From: http://www.pasteur.fr/infosci/ archives/mon/im_ele.html
How far does Monod’s statement that “what is true for E. coli is true for the elephant” (depicted by Monod in Figure 2) take us in our assessment of mRNA lifetimes in other organisms? The short answer is not very. Whereas the median mRNA degradation lifetime is roughly 5 minutes in E. coli, the mean lifetime is ≈20 minutes in the case of yeast (see Figure 1B) and 600 minutes (BNID 106869) in human cells. Interestingly, a clear scaling is observed with the cell cycle times for these three cell types of roughly 30 minutes (E. coli), 90 minutes (budding yeast) and 3000 minutes (human), under the fast exponential growth rates that the cells of interest were cultivated in for these experiments. As a rule of thumb, these results suggest that the mRNA degradation time scale in these cases is thus about a fifth of the fast exponential cell cycle time.
Messenger RNA is not the only target of degradation. Protein molecules are themselves also the target of specific destruction, though generally, their lifetimes tend to be longer than the mRNAs that lead to their synthesis, as discussed below. Because of these long lifetimes, under fast growth rates the number of copies of a particular protein per cell is reduced not because of an active degradation process, but simply because the cell doubles all its other constituents and divides into two daughters leaving each of the daughters with half as many copies of the protein of interest as were present in the mother cell. To understand the dilution effect, imagine that all protein synthesis for a given protein has been turned off while the cell keeps on doubling its volume and shortly thereafter divides. In terms of absolute values, if the number of copies of our protein of interest before division is N, afterwards it is N/2. In terms of concentrations, if it started with a concentration c, during the cell cycle it got diluted to c/2 by the doubling of the volume. This mechanism is especially relevant in the context of bacteria where the protein lifetimes are often dominated by the cell division time. As a result, the total protein loss rate α (the term carrying the same meaning as γ for mRNA) is the sum of a part due to active degradation and a part due to the dilution that occurs when cells divide and we can write the total removal rate in the form α=αactive+αdilution.
The statement that protein lifetimes in rapidly growing bacteria are longer than the cell cycle itself is supported by measurements already from the 1960s where radioactive labeling was used as a way to measure rates. In this case, degradation of labeled proteins was monitored by looking at the accumulation of radioactive amino acids in a rapidly exchanged perfusate. Only 2-7% of the proteome was estimated to be actively degraded, with a half-life of about 1 hour (BNID 108404). More recently, studies showed specific cases of rapid degradation including some sigma factors, transcription factors, and cold shock proteins, yet the general statement that dilution is the dominant protein loss mechanism in bacteria remains valid.
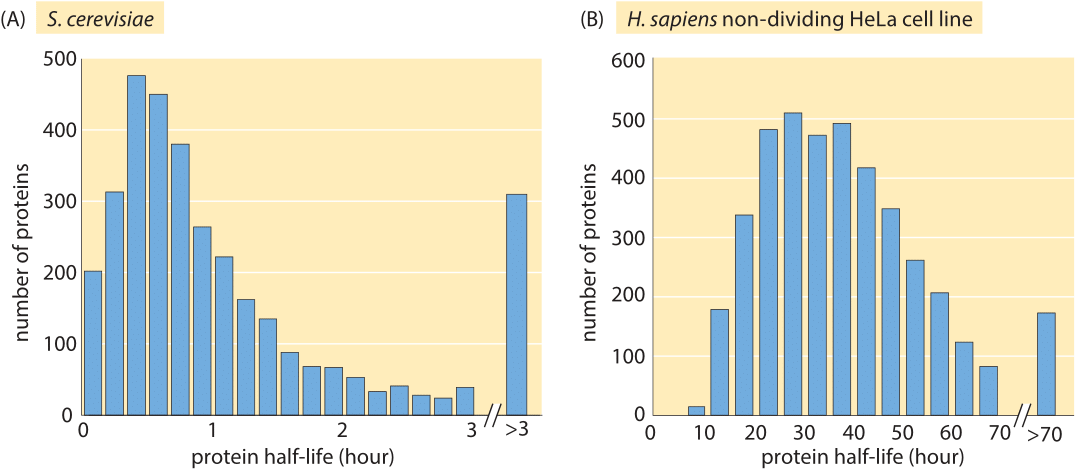
Figure 3: Measured half lives of proteins in budding yeast and a HeLa human cancer cell line. The yeast experiment used the translation inhibitor cycloheximide which disrupts normal cell physiology. The median half life of the 4100 proteins measured in the non-dividing HeLa cell is 36 hours. (A, adapted from A. Belle et al., Proc. Natl Acad. Sci. USA 103:13004, 2006; B, adapted from S. Cambridge et al, J. Proteome Res. 10:5275, 2011.)
Just like with the genome-wide studies of mRNA lifetimes described above, protein lifetimes have been subjected to similar scrutiny. Surprisingly, we could not find genome-wide information in the literature on the degradation times for proteins in E. coli but in budding yeast, a translation-inhibition drug (cycloheximide) was used to inhibit macromolecular synthesis and then protein content was quantified at later time points using Western blots. The Western blot technique is a scheme in which the proteins of interest are fished out by specific binding to some part of the protein (for example by antibodies) and the amount of protein is read off of the intensity of a reporter which has been calibrated against a standard. Inhibiting translation might cause artifacts, but with that caveat in mind, the measured lifetimes shown in Figure 3A using the method of translation-inhibition reveal the longer lifetimes of proteins in comparison with their mRNA counterparts, with a mean lifetime of roughly 40 minutes (BNID 104151). Issues with precision of these results still calls for the development of new methods for constructing such surveys.
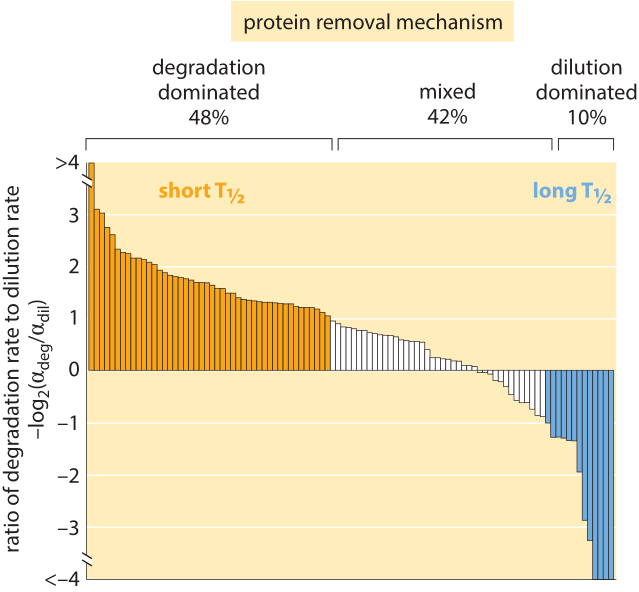
Figure 4: Distribution of 100 proteins from a H1299 human cell line, comparing the rate of degradation to dilution to find which removal mechanism is dominant for each of the proteins. The overall removal rate alpha ranges between 0.03 and 0.82 hour-1 with an average of 0.1+/-0.09 hour-1. This is equivalent to half life of ≈7 hours via the relationship half-life, T1/2 = ln(2)/alpha. Adapted from E. Eden et al, Science, 331:764, 2011.
Using modern fluorescence techniques it has become possible to measure degradation rates of human proteins in vivo without the need to lyse the cells. The long removal times observed in human cells are shown in Figure 3B. The measurements were done by fusing the protein of interest to a fluorescent protein. Then, by splitting the population into two groups, one of which is photobleached and the other of which is not, and watching the reemergence of fluorescence in the photobleached population, it is possible to directly measure the degradation time. As shown in Figure 4, for human cells there is an interesting interplay between active degradation and protein removal by dilution. Active degradation half lives were seen to be broadly distributed with the fastest observed turnover of less than an hour and the slowest showing only negligible active degradation in the few days of time lapse microscopy. These results can be contrasted with a prediction based on the N-end rule that states that the amino acid at the N terminal of the protein has a strong effect on the active degradation performed through the ubiquitination system. For example, in mammalian systems it predicts that arginine, glutamate and glutamine will lead to degradation within about an hour while valine, methionine and glycine will be stable for tens of hours.
In trying to characterize the lifetimes of the most stable proteins, mice were given isotopically labeled food for a short period at an early age and then analyzed a year later. The results showed that most proteins turnover within a few days but a few show remarkable stability. Histone half lives were measured at ≈200 days; even more tantalizing, the nuclear pore consists of a protein scaffold with half life >1 year while all the surrounding components are replenished much faster.