How long do the different stages of the cell cycle take?
Replication is one of the hallmark features of living matter. The set of processes known as the cell cycle which are undertaken as one cell becomes two has been a dominant research theme in the molecular era with applications that extend far and wide including to the study of diseases such as cancer which is sometimes characterized as a disease of the cell cycle gone awry. Cell cycles are interesting both for the ways they are similar from one cell type to the next and for the ways they are different. To bring the subject in relief, we consider the cell cycles in a variety of different organisms including a model prokaryote, for mammalian cells in tissue culture and during embryonic development in the fruit fly. Specifically, we ask what are the individual steps that are undertaken for one cell to divide into two and how long do these steps take?
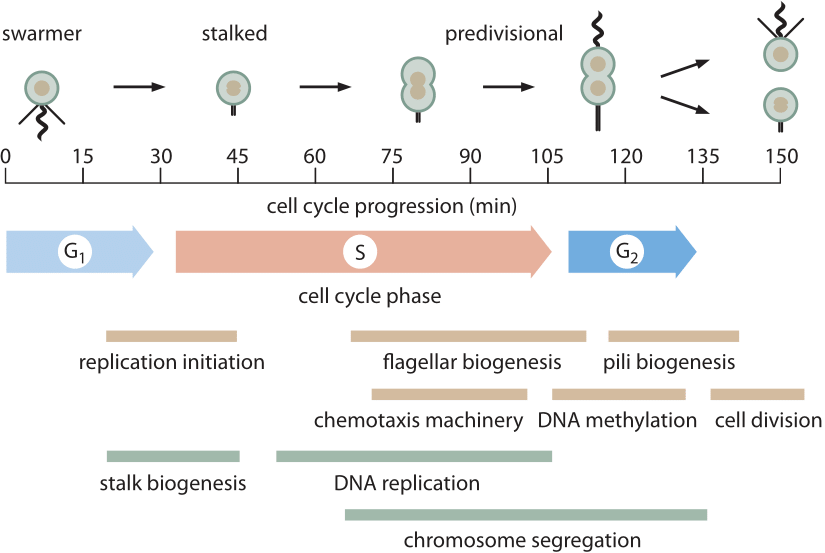
Figure 1: The 150 min cell cycle of Caulobacter is shown, highlighting some of the key morphological and metabolic events that take place during cell division. M phase is not indicated because in Caulobacter there is no true mitotic apparatus that gets assembled as in eukaryotes. Much of chromosome segregation in Caulobacter (and other bacteria) occurs concomitantly with DNA replication. The final steps of chromosome segregation and especially decatenation of the two circular chromosomes occurs during G2 phase. (Adapted from M. T. Laub et al., Science 290:2144, 2000.)
Arguably the best-characterized prokaryotic cell cycle is that of the model organism Caulobacter crescentus. One of the appealing features of this bacterium is that it has an asymmetric cell division that enables researchers to bind one of the two progeny to a microscope cover slip while the other daughter drifts away enabling further study without obstructions. This has given rise to careful depictions of the ≈150 minute cell cycle (BNID 104921) as shown in Figure 1. The main components of the cell cycle are G1 (first Growth phase, ≈30 min, BNID 104922), where at least some minimal amount of cell size increase needs to take place, S phase (Synthesis, ≈80 min, BNID 104923) where the DNA gets replicated and G2 (second Growth phase, ≈25 min, BNID 104924) where chromosome segregation unfolds leading to cell division (final phase lasting ≈15 min). Caulobacter crescentus provides an interesting example of the way in which certain organisms get promoted to “model organism’’ status because they have some particular feature that renders them particularly opportune for the question of interest. In this case, the cell-cycle progression goes hand in hand with the differentiation process giving readily visualized identifiable stages making them preferable to cell-cycle biologists over, say, the model bacterium E. coli.
The behavior of mammalian cells in tissue culture has served as the basis for much of what we know about the cell cycle in higher eukaryotes. The eukaryotic cell cycle can be broadly separated into two stages, interphase, that part of the cell cycle when the materials of the cell are being duplicated and mitosis, the set of physical processes that attend chromosome segregation and subsequent cell division. The rates of processes in the cell cycle, are mostly built up from many of the molecular events such as polymerization of DNA and cytoskeletal filaments whose rates we have already considered. For the characteristic cell cycle time of 20 hours in a HeLa cell, almost half is devoted to G1 (BNID 108483) and close to another half is S phase (BNID 108485) whereas G2 and M are much faster at about 2-3 hours and 1 hour, respectively (BNID 109225, 109226). The stage most variable in duration is G1. In less favorable growth conditions when the cell cycle duration increases this is the stage that is mostly affected, probably due to the time it takes until some regulatory size checkpoint is reached. Though different types of evidence point to the existence of such a checkpoint, it is currently very poorly understood. Historically, stages in the cell cycle have usually been inferred using fixed cells but recently, genetically-encoded biosensors that change localization at different stages of the cell cycle have made it possible to get live-cell temporal information on cell cycle progression and arrest.
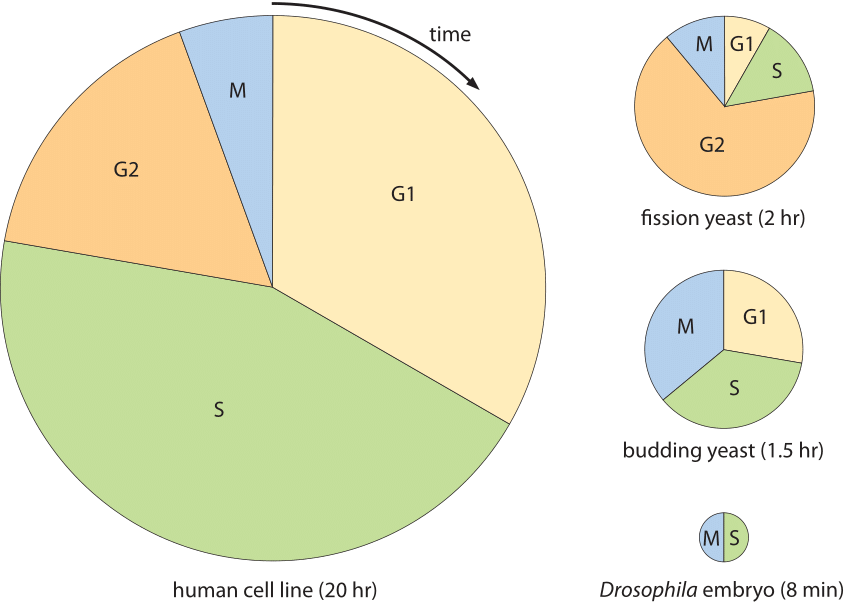
Figure 2: Cell cycle times for different cell types. Each pie chart shows the fraction of the cell cycle devoted to each of the primary stages of the cell cycle. The area of each chart is proportional to the overall cell cycle duration. Cell cycle durations reflect minimal doubling times under ideal conditions. (Adapted from “The Cell Cycle – Principles of Control” by David Morgan.)
How does the length of the cell cycle compare to the time it takes a cell to synthesize its new genome? A decoupling between the genome length and the doubling time exists in eukaryotes due to the usage of multiple DNA replication start sites. For mammalian cells it has been observed that for many tissues with widely varying overall cell cycle times, the duration of the S phase where DNA replication occurs is remarkably constant. For mouse tissues such as those found in the colon or tongue, the S phase varied in a small range from 6.9 to 7.5 hours (BNID 111491). Even when comparing several epithelial tissues across human, rat, mouse and hamster, S phase was between 6 and 8 hours (BNID 107375). These measurements were carried out in the 1960s by performing a kind of pulse-chase experiment with the radioactively labeled nucleotide thymidine. During the short pulse, the radioactive compound was incorporated only into the genome of cells in S phase. By measuring the duration of appearance and then disappearance of labeled cells in M phase one can infer how long S phase lasted The fact that the duration of S phase is relatively constant in such cells is used to this day to estimate the duration of the cell cycle from a knowledge of only the fraction of cells at a given snapshot in time that are in S phase. For example, if a third of the cells are seen in S phase which lasts about 7 hours, the cell cycle time is inferred to be about 7 hours/(1/3) ≈20 hours. Today these kinds of measurements are mostly performed using BrdU as the marker for S phase. We are not aware of a satisfactory explanation for the origin of this relatively constant replication time and how it is related to the rate of DNA polymerase and the density of replication initiation sites along the genome.
The diversity of cell cycles is shown in Figure 2 and depicts several model organisms and the durations and positioning of the different stages of their cell cycles. An extreme example occurs in the mesmerizing process of embryonic development of the fruit fly Drosophila melanogaster. In this case, the situation is different from conventional cell divisions since rather than synthesizing new cytoplasmic materials, mass is essentially conserved except for the replication of the genetic material. This happens in a very synchronous manner for about 10 generations and a replication cycle of the thousands of cells in the embryo, say between cycle 10 and 11, happens in about 8 minutes as shown in Figure 2 (BNID 103004, 103005, 110370). This is faster than the replication times for any bacteria even though the genome is ≈120 million bp long (BNID 100199). A striking example of the ability of cells to adapt their temporal dynamics.