How long does it take cells to copy their genomes?
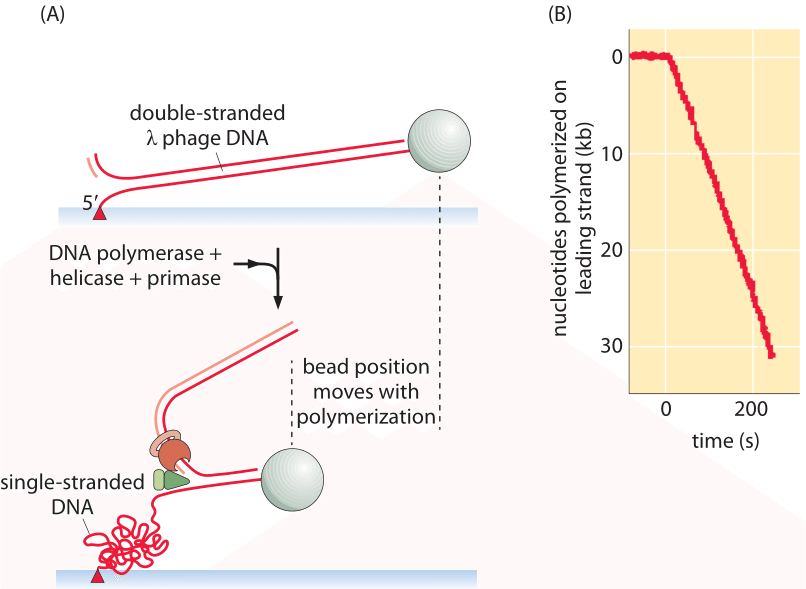
Figure 1: Schematic of single-molecule experiment used to measure the rate of replication. (A) The progress of the replication process performs leading strand synthesis and thus converts double-stranded into single-stranded (plus another double stranded) DNA. (B) Because the “spring constant” of single-stranded DNA is larger than that for double-stranded DNA, the stretched tether recoils resulting in the bead position time course shown. Adapted from: Lee et al, DNA primase acts as a molecular brake in DNA replication. (Adapted from J.-B. Lee et al., Nature. 439:621, 2006.)
Genomes and the management of the vast array of information they contain are one of the signature features that make living matter so different from its inanimate counterpart. From the moment of the inception of the modern view of DNA structure, Watson and Crick made it clear that one of the most compelling features of the DNA double-helix structure is that it suggests a mechanism for its own replication. But what sets the time scale for the replication process itself and how do the mechanisms and associated rates differ from one organism to the next? Does the time required to complete replication ever impose a limitation on the growth rate of the organism?
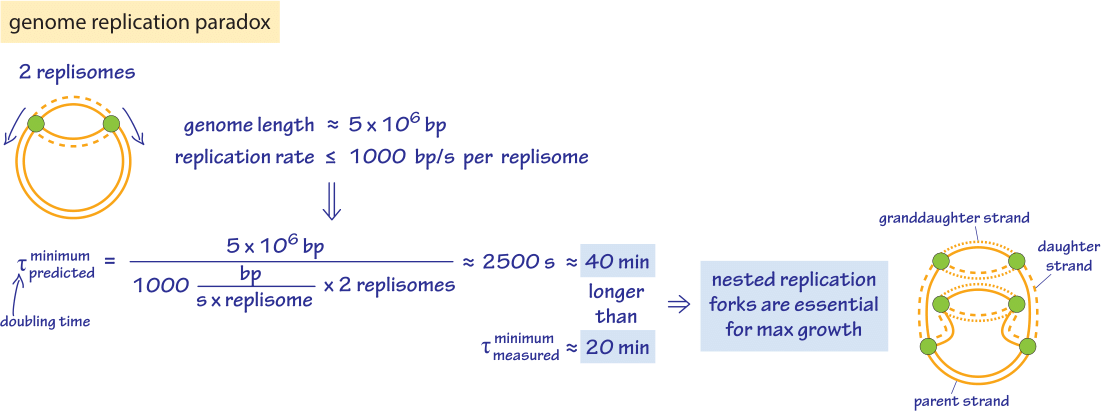
Figure 2: Nested replication forks. The schematic shows the way in which multiple rounds of replication are taking place simultaneously in rapidly dividing E. coli cells. This picture is used to make an estimate of the time to replicate the full bacterial genome. Recent measurements using fluorescently tagged components of the replication machinery reported values of 55-65 minutes for DNA replication (BNID 109252) suggesting an in vivo average replication rate of about 600 bp/s (BNID 109251).
An elegant way to directly measure the replication rate is through the use of a single-molecule technique in which the progress of the replication machinery is monitored by using a microscope to watch the motion of a tiny bead attached to the DNA template, as shown in Figure 1. By permitting only leading-strand synthesis, the replication process results in the conversion of double-stranded DNA into one double-stranded fragment and a second single-stranded fragment on the uncopied strand. The trick in this method is that it exploits the difference in entropic elasticity of the single-stranded and double-stranded fragments. As a result, with increasing replication, more of the template is converted into the single-stranded form which as seen in Figure 1 serves as a much stronger entropic spring than the double-stranded fragment whose persistence length is orders of magnitude larger. The spring moves the bead at the same rate as the polymerase proceeds forward, serving as a readout of the underlying replication dynamics. These measurements resulted in an in vitro replication rate of 220 ± 80 nucleotides/s (BNID 103995) for the replication machinery from a T7 bacterial virus. With a genome size of ≈40,000 bp and without taking into account initiation and similar processes that might complicate directly importing these in vitro insights to the in vivo setting, we can estimate that it will require at least 40,000 bp/220 bp/s ≈200 s or about 3 minutes to replicate the compact viral genome.
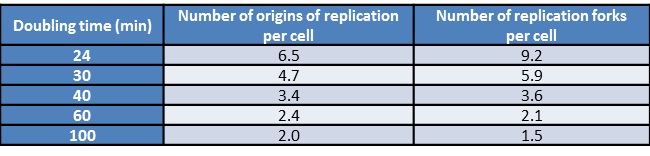
Table 1: Number of origins of replication as a function of generation time. Fast growing E. coli cells have multiple origins of replication present simultaneously. The data in this table shows how the number of replication origins grows with the increasing rapidity of cell division (BNID 102356).
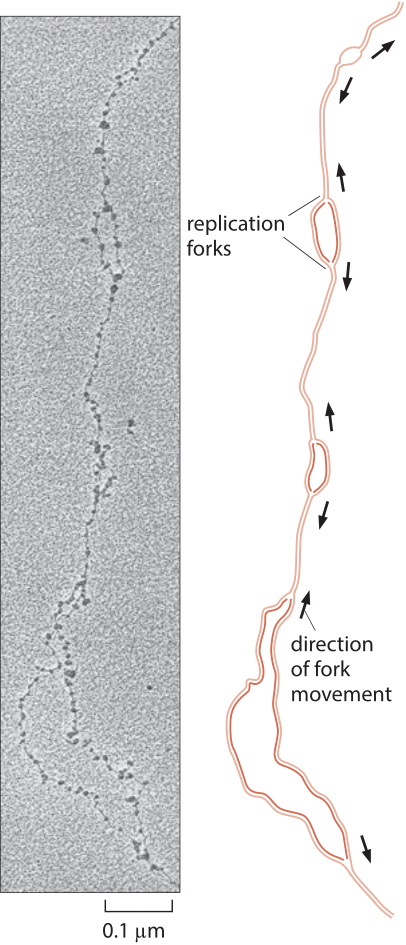
Figure 3: Replication forks in D. melanogaster. Replication forks move away in both directions from replication origins. (Electron micrograph courtesy of Victoria Foe. Adapted from B. Alberts et al., Molecular Biology of the Cell, 5th ed. New York, Garland Science, 2008.)
Given these insights into the replication rate, how do they stack up against the known division times of different cell types? E. coli has a genome of roughly 5 million bp (BNID 100269). Replication rates are observed to be several hundred bp/sec (BNID 104120, 109251). Further, replication in these bacteria takes place with two replication forks heading in opposite directions around the circular bacterial chromosome. As shown in Figure 2, the replication rates imply that it should take the two replisomes at least 2500 sec (≈40 minutes) to replicate the genome, a number that is much longer than the minimal division time of ≈20 minutes (BNID 103514). This interesting estimate delivers a paradox that is resolved by the observation that E. coli under ideal growth conditions employs nested replication forks like those seen in Figure 2 that begin replicating the granddaughter and grand granddaughter cell’s genomes while the daughter cells are still themselves engaged in replication. At fast growth rates more than 6 origins of replication and over 10 replication forks coexist in a single cell (BNID 102356) as deduced from elegant models on the co-dependence of the generation time, genome replication time and the numbers of replication forks and origins. Recently, single-molecule microscopy revealed that the most common stoichiometry of the replication machinery, the replisome, consists of 3 DNA polymerases per replisome in contrast to the naïve picture of 2 DNA polymerases (BNID 107686). It seems that the third polymerase can sometimes be engaged in the lagging strand replication together with another polymerase or in other cases to be awaiting engagement in the replication process.
Eukaryotic genomes are usually much larger than those of their prokaryotic cousins and as a result, the replication process must depend upon more than a single origin of replication. The number of origins leading to replication is a subject of active research recently using microarrays and deep sequencing to find peaks of DNA content in S-phase indicating putative origins. Estimates for the total number of origins still vary widely, for example in mouse they range from as low as 1,000 to as many as 100,000, while for Drosophila the estimate is about 10,000 (BNID 107654, 109283). Each origin is associated with a replisome that proceeds at a rate of 4-40 bp/s or roughly 1 kb/min (BNID 104930, 104935, 104936, 104937). A classic view of the replication process has been offered by electron microscopy images such as that presented in Figure 3 that shows a collection of replication forks associated with the copying of the Drosophila genome. From the rate of replication and the observed distance between replication forks one can see that a complete replication cycle can proceed much more quickly than if there were only one replication origin. This is a necessity given the rapid genome replication in the early stage of D. melanogaster development where the embryo replicates its ≈120 million bp genome (100199) at a dizzying pace of once every ≈8 minutes (BNID 101971). In humans the S phase in many cell types is on the order of 10 hours (BNID 103742, 103741, 102204). What selective force should push the DNA replication time to be relatively short in cells that have very long overall cell cycle times? and for fast growing cells why not make the replication time even shorter by employing more origins of replication?
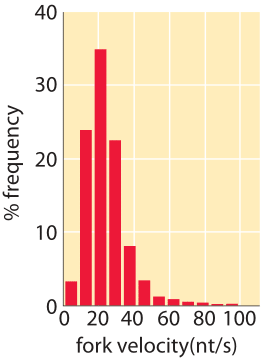
Figure 4: Histogram of fork velocities for human primary keratinocytes (mean=1.5 kb/min; N=5460). (Adapted from C. Conti et al., Molecular Biology of the Cell, 18:3059, 2008.)