How many proteins are in a cell?
As the dominant players in the cell in terms of both biomass and functionality, proteins get a large share of the attention in molecular and cell biology research. Yet, a small shift in emphasis to challenges of a more quantitative nature about these proteins raises all sorts of unanswered questions. For example, how many proteins are in a cell? That is, the total number of protein molecules rather than the number of different types. Before reviewing published measurements we can try and estimate this value from properties of the cell we may already know.
Protein content scales roughly linearly with cell volume or mass. Given that cell volume can change several fold based on growth conditions or which specific strain was used, we will first analyze the number of proteins per unit cell volume (i.e. protein number density) and later multiply by cell volume to find the actual number of proteins per cell for our cell of interest.
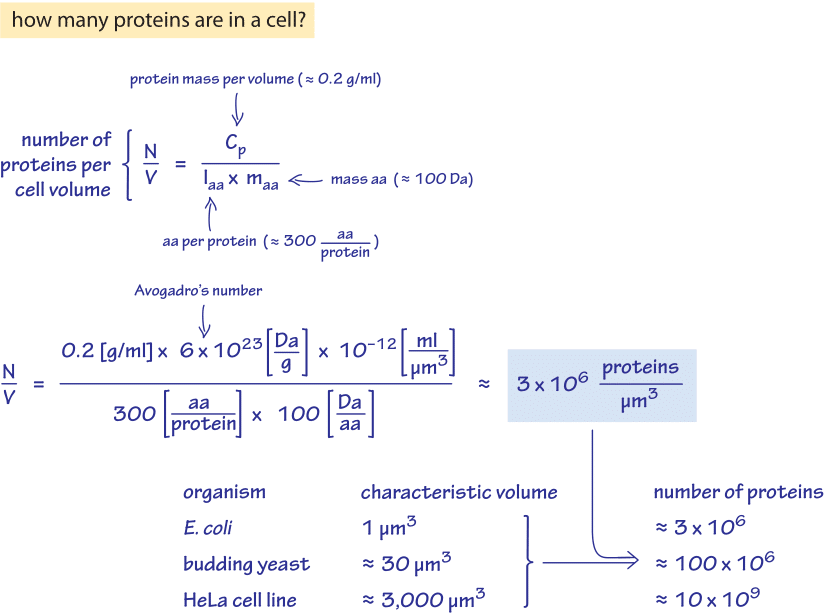
Figure 1: A back of the envelope calculation of the number of proteins per cell volume. Application for selected model organisms based on their characteristic cell volumes is also given. Estimate is based on generic parameter values, for more accurate organism specific values see main text.
Our first method for estimation is shown as a “back of the envelope” calculation developed in Figure 1 using rounded “generic” parameter values. The estimation relies on knowledge of the protein mass per unit volume (denoted by cp). The units of cp are [g protein]/[ml cell volume] and this parameter has been reported for different cell types. We denote by laa the average length, in amino acids, of a protein and the average mass of an amino acid by maa. In light of these definitions, the number of proteins per unit volume is given by
N/V=cp/(laa*maa).
In E. coli and other bacteria we use an average protein length, laa, of 300 aa/protein and in budding yeast, fission yeast and human cells, we use the larger value of 400 aa/protein. Values are rounded to one significant figure (within about 10-20% accuracy), in line with variations in estimated values in the literature. The average lengths used were calculated by weighting the protein lengths by their abundance in the cell. This takes into account issues such as high abundance proteins tending to be smaller than low abundance proteins.
Moving on to the protein concentration in the cells, reports are surprisingly scarce with old measured values for cp being 0.24 g/ml for E. coli and 0.28 g/ml for budding yeast (BNID 105938, 108879, 108263, 108874). Values are expected to be similar when the concentration values refer to either the total cell volume and protein complement including membrane-associated proteins or solely to cytoplasmic volume and proteins). Assuming an average amino acid mass of 100 Da and with some unit conversions we arrive at (also schematically shown with generic parameter values in Figure 1)

and

Though this is what we aimed for, the reader might be wondering about the value of cp we used. We can derive it based on other better known properties: cell density, water content and protein fraction of dry mass. The total cell density, d, is about 1.1 g/ml (BNID 103875, 102239, 106439). The water content which we denote by w, is in E. coli ≈70% and in budding yeast ≈60% by mass (BNID 105482, 103689). The protein fraction of the dry mass, p, is ≈55% in E. coli and ≈40% in yeast. The relationship between these quantities is: cp=d×(1-w)×p. Plugging in the numbers we find,
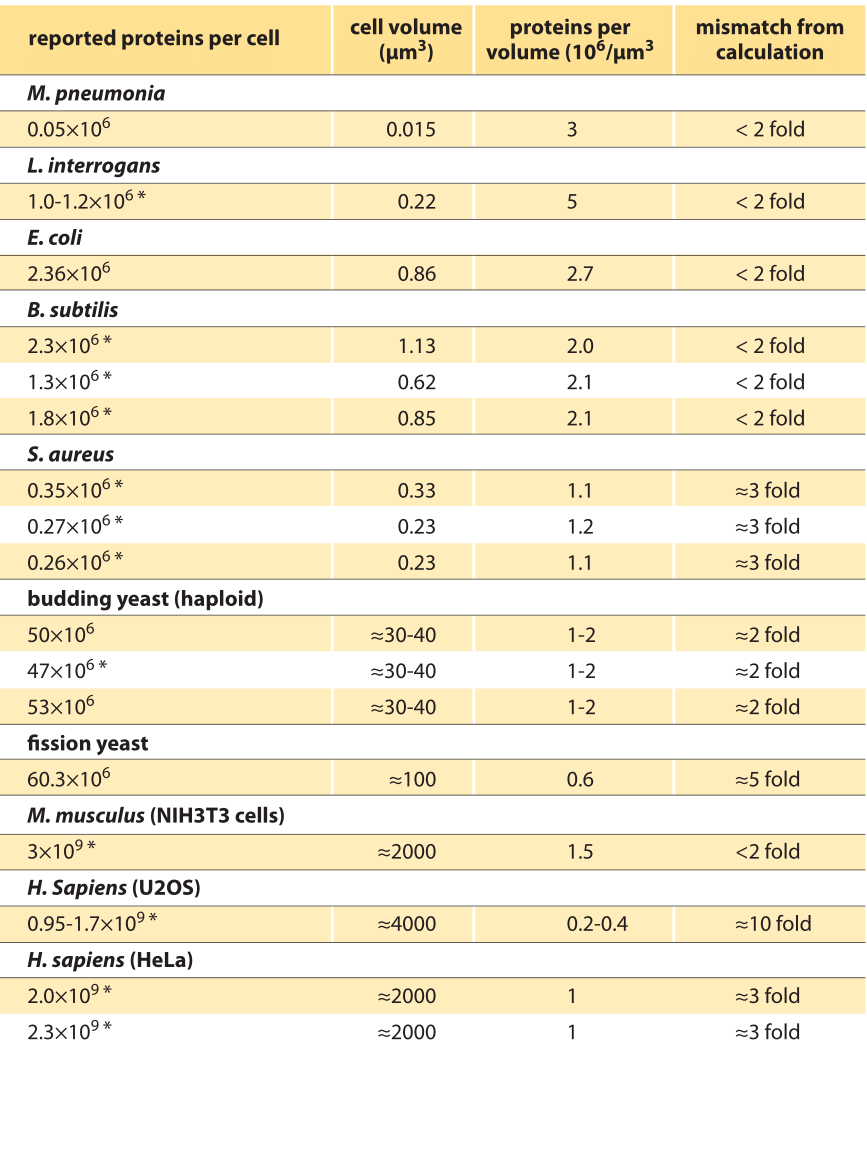
Table 1: Range of estimates on the number of proteins per cell based on various papers. In some cases the number is inferred from supplementary information and was not reported as such. When cell volume was not reported in study, literature values under similar conditions was used. * Value for total proteins per cell was not explicitly reported and is based on summing the abundance values as reported in the supplementary material across the proteome.
cp,coli=1.1 g/ml × (1-0.7) × 0.55=0.19 g/ml
and
cp,yeast=1.1 g/ml × (1-0.6) × 0.4=0.18 g/ml.
The resulting values are smaller than those quoted above by 20-40% and lead to estimates of ≈3×10⁶ protein/µm3 and ≈2×10⁶ protein/µm3 in E. coli and budding yeast, respectively.
We can now move to use characteristic volumes to reach the number of proteins per cell rather than per unit cell volume. For an E. coli cell of 1 µm3 volume there is not much that has to be done as this is our unit of cell volume and the two estimates give a range of 2-4 million proteins per cell. For a budding yeast cell of 40 µm3 (haploid, BNID 100430, 100427) the two estimates give a range of 90-140 million proteins per cell. Extrapolating these protein densities to mammalian cells a value of about 1010 proteins per cell is predicted for characteristic cell lines that have average volumes of 2000-4000 µm3.
How do these values compare to previous reports in the literature? Table 1 shows a compilation of values based on published proteome-wide studies. Notably, in many cases a total sum over all proteins was not reported and was inferred for our purposes by summing all measured abundances. Some of the total sums are in line with the general estimates above, mostly those for bacteria. In contrast, many of the values for eukaryotic cells, covering yeast and mammalian cells, are a factor of as much as 10-fold lower than predicted. Whether this seeming discrepancy is due to calibration issues in the mass spectrometry studies that measured them or inaccuracies in the parameter values used in the estimate remains to be learned (R. Milo, Bioessays 35:1050, 2013). We take this as indication that there is a standing challenge for careful analysis in order to achieve definitive answers for those interested in quantitatively mapping the cell’s contents.