How many ribosomes are in a cell?
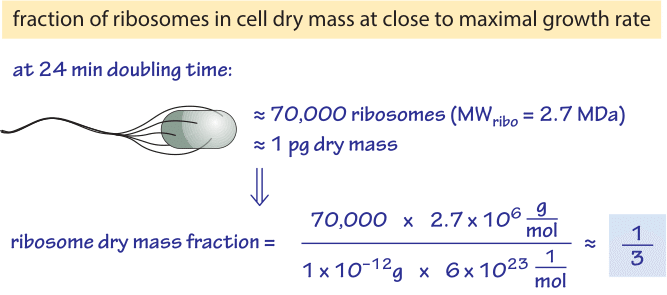
Figure 1: Back of the envelope calculation showing the fraction of the cell dry mass dedicated to ribosomes at a fast bacterial growth rate. Number of ribosomes based on BNID 101441 and cell dry mass based on BNID 103891.
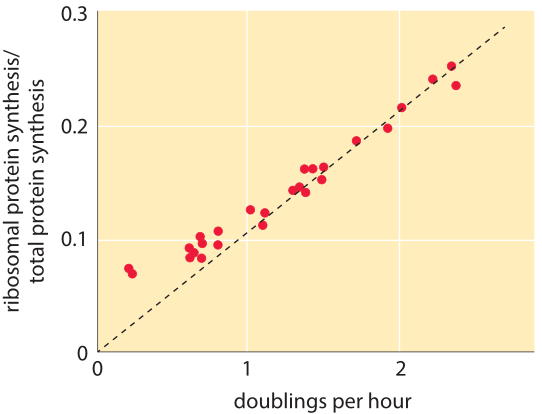
Figure 2: Fraction of ribosomal protein synthesis rate out of the total cell protein synthesis. Measurements were performed on cultures in balanced growth and thus the relative rate is similar to the relative abundance of the ribosomal proteins in the proteome. Adapted from J. L. Ingraham et al., “Physiology of the bacterial cell” page 276, Sinauer 1990.
One of the familiar refrains in nearly all biology textbooks is that proteins are the workhorses of the cell. As a result, cells are deeply attentive to all the steps between the readout of the genetic information hidden within DNA and the expression of active proteins. One of the ways that the overall rhythm of protein production is controlled is through tuning the number of ribosomes. Ribosomes are one of the dominant constituents in cells and in rapidly dividing cells, they begin to take up a significant fraction of the cellular interior. The RNA making up these ribosomes accounts for ≈85% of the cell’s overall RNA pool (BNID 106421). Though DNA replication, transcription and translation are the three pillars of the central dogma, within the proteome, the fraction dedicated to DNA polymerase (BNID 104123) or RNA polymerase (BNID 101440) is many times smaller than the tens of percent of the cell protein dedicated to ribosomes (BNID 107349, 102345). As such there is special interest in the abundance of ribosomes and the dependence of this abundance on growth rate. The seminal work of Schaechter et al. established early on the far-from-trivial observation that the ribosomal fraction is a function of the growth rate and mostly independent of the substrate, that is, different media leading to similar growth rates tend to have similar ribosomal fractions (M. Schaechter et al. J Gen Microbiol. 19:592, 1958). Members of the so called “Copenhagen school” (including Schaechter, Maaloe, Marr, Neidhardt, Ingraham and others) continued to make extensive quantitative characterization of how the cell constituents vary with growth rate that serve as benchmarks decades after their publication and provide a compelling example of quantitative biology long before the advent of high throughput techniques.
Table 1 shows the number of ribosomes in E. coli at different doubling times. In the table it is also evident how the cell mass (and volume) depends strongly on growth rate, with faster dividing cells being much larger. As calculated in the fourth column of the table, and schematically in Figure 1, at a fast doubling time of 24 minutes the 72,000 ribosomes per cell represent over 1/3 of the dry mass of the cell (BNID 101441, 103891). Accurate measurements of this fraction from the 1970s are shown in Figure 2.
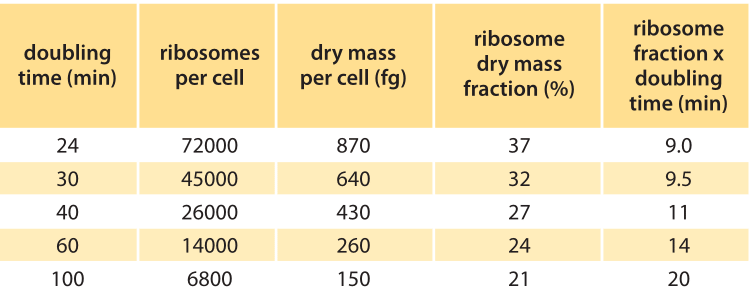
Table 1: Number and fraction of ribosomes as a function of the doubling time. Values are rounded to one significant digit. Ribosomes per cell are from “E. coli & Salmonella handbook”, Chapter 97, Table 3. Dry mass per cell is from E. coli & Salmonella, Chapter 97, Table 2. Ribosome dry mass fraction is calculated based on ribosome mass of 2.7MDa (BNID 100118).
Several models have been set forth to explain these observed trends for the number of ribosomes per cell. In order to divide, a cell has to replicate its protein content. If the translation rate is constant there is a neat deduction to be made. We thus make this assumption even though the translation rate varies from ≈20 aa/sec in E. coli at fast growth rate to closer to ≈10 aa/sec under slow growth (BNID 100059). Think of a given cell volume in the cytoplasm. Irrespective of the doubling time, the ribosomes in this volume have to produce the total mass of proteins in the volume within a cell cycle. If the cell cycle becomes say three times shorter then the necessary ribosome concentration must be three times higher to complete the task. This tacitly assumes that the polymerization rate is constant, that active protein degradation is negligible and that the overall protein content does not change with growth rate. This is the logic underpinning the prediction that the ribosomal fraction is proportional to the growth rate. Stated differently, as the doubling time becomes shorter, the required ribosomal fraction is predicted to increase such that the ribosomal fraction times the doubling time is a constant reflecting the total proteome concentration. The analysis also suggests that the synthesis rate scales as the growth rate squared, because the time to reach the required ribosome concentration becomes shorter in proportion with the doubling time. How well does this toy model fit the experimental observations?
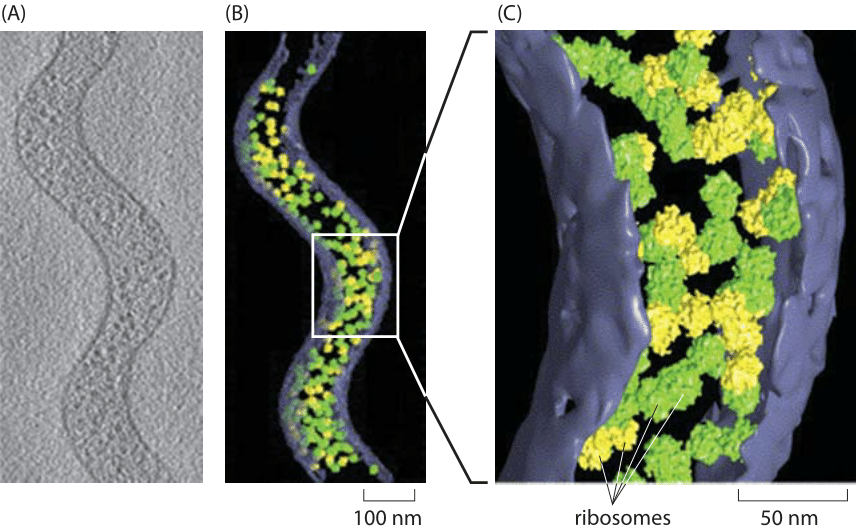
Figure 3: Cryo-electron tomography of the tiny Spiroplasma melliferum. Using algorithms for pattern recognition and classification, components of the cell such as ribosomes were localized and counted. (A) Single cryo-electron microscopy image. (B) 3D reconstruction showing the ribosomes that were identified. Ribosomes labeled in green were identified with high fidelity while those labeled in yellow were identified with intermediate fidelity. (C) Close up view of part of the cell. Adapted from J. O. Ortiz et al., Journal of Structural Biology 156:334, 2006.
As shown in the right column of Table 1 and in Figure 2, the ratio of ribosome fraction to growth rate is relatively constant for the faster growth rates in the range of 24-40 minutes as predicted by the simple model above and the ratio is not constant at slow growth rates. Indeed at slower growth rates the ribosome rate is suggested to be slower (BNID 100059). More advanced models (e.g. M. Scott et al., Science, 330:1099, 2010) consider different constituents of the cells (for example, a protein fraction that is independent of growth rate, a fraction related to the ribosomes and a fraction related to the quality of the growth medium) that result in more nuanced predictions that fit the data over a larger range of conditions. Such models are a large step towards answering the basic question of what governs the maximal growth rates of cells.
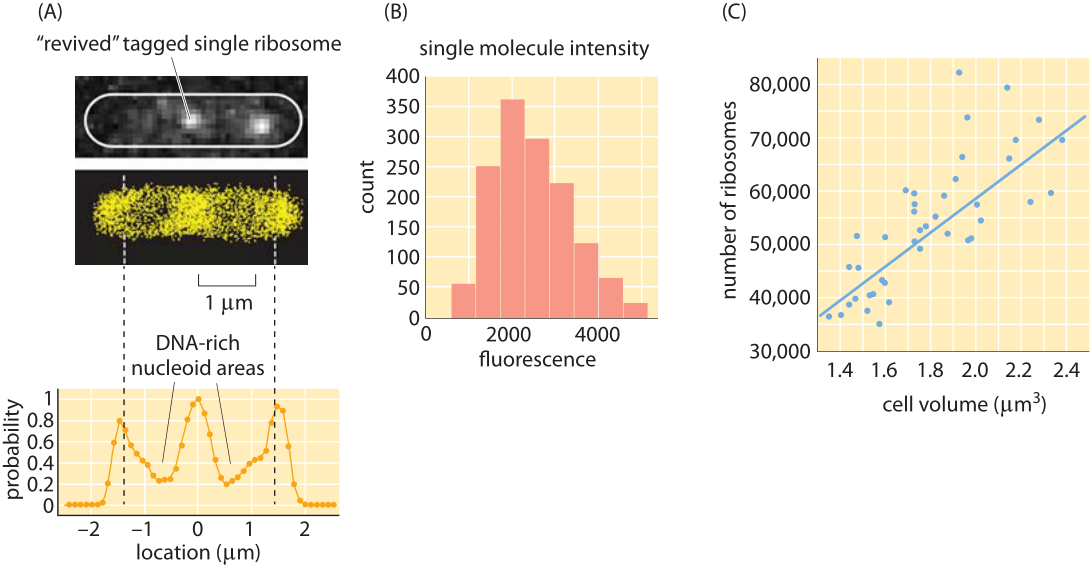
Figure 4: Counting and localizing ribosomes inside cells using single molecule microscopy. (A) Two ribosomes identified from the full super-resolution image shown below. (B) Single-molecule intensity distribution. (C) Number of ribosomes as a function of cellular volume. (Adapted from S. Bakshi et al, Molecular Microbiology 85:21, 2012.)
Traditionally, measuring the number of ribosomes per cell was based on separating the ribosomes from the rest of the cell constituents, measuring what fraction of the total mass comes from these ribosomes and then with conversion factors based on estimations of cell size and mass, ribosomal molecular weight etc. inferring the abundance per cell. Recently a more direct approach is becoming available based on explicitly counting individual ribosomes. In cryo-electron microscopy, rapidly frozen cells are visualized from many angles to create what is known as a tomographic 3D map of the cell. The known structure of the ribosome is then used as a template that can be searched in the complete cell tomogram. This technique was applied to the small, spiral-shaped prokaryote Spiroplasma melliferum. As shown in Figure 3, in this tiny cell, 10-100 times smaller than E. coli by volume (BNID 108949, 108951) and slower in growth, researchers counted on average 1000 ribosomes per cell (BNID 108945). Similar direct counting efforts have been made using the super-resolution techniques that have impacted fluorescence microscopy as shown in Figure 4 where a count was made of the ribosomes in E. coli. A comparison of the results from these two methods is made in Figure 5 where a simple estimate of the ribosomal density is made from the cryo-electron microscopy images and this density is then scaled up to a full E. coli volume, demonstrating an encouraging consistency between the different methods.

Figure 5: Back of envelope estimate on how many ribosomes are in a cellular volume.