How many virions result from a single viral infection?
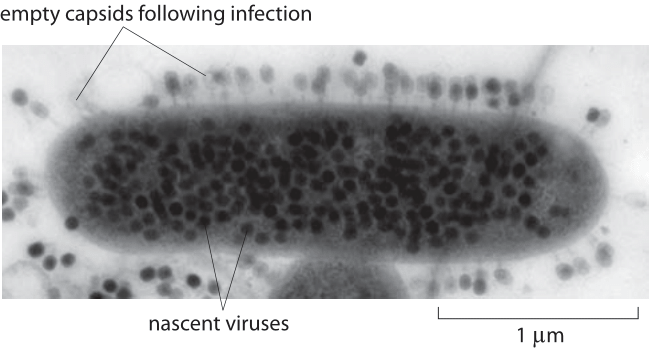
Figure 1: A transmission electron micrograph of a thin section of Escherichia coli K-12 infected with Bacteriophage T4. Dark viruses on the outside are ones that did not eject their DNA into the bacterial host. Image courtesy of John Wertz.
Viruses proliferate in natural environments by infecting cells and hijacking their replication and protein synthesis machinery. After new viral proteins are synthesized and assembled, bursts of viruses are released from the infected (and usually soon to be dead) cells to repeat the process all over again. How many viruses are released from each infected cell? This parameter is referred to as the viral burst size, alluding to the fact that often virus emission either leads to cell lysis (bacteriophage) or cell death (HIV infection of T-cells). The emission of new viruses from an infectedcell hence occurs as a burst with characteristic numbers of viruses and with time scales lasting from minutes to days depending upon the kind of virus and host. Burst sizes for different viruses have a large range corresponding in turn with the range of different sizes of the host cells. For example, SIV, a cousin and model for the HIV virus, is released from infected T cells with a burst size of ≈50,000 (BNID 102377) whereas cyanobacterial viruses have characteristic burst sizes of ≈40-80 (BNID 103247, 104841, 104842) and phage lambda and other phages (such as T4, T5 and T7) attacking bacteria have burst sizes of ≈100-300. (BNID 105025, 105870). An example of a host bacterium prior to the burst process itself is shown in Figure 1.
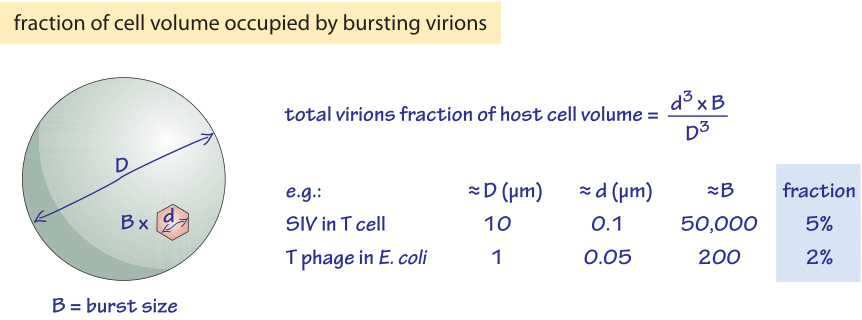
Figure 2: Back of the envelope calculation showing how the fraction of volume occupied by bursting virions is roughly similar in conditions of very different burst size.
One interesting way to garner an impression of the impact of a viral infection on the host metabolism is by thinking about the volume taken up by the newly synthesized viruses in comparison with the size of the host cell. In particular, we ask what fraction of the host cell volume is occupied by all the viruses making up a viral burst? These volumes can be thought of as a proxy for biomass and thus reflect on the cell’s resources that were seized. An SIV virion is roughly 100 nm in diameter and thehost cell has a corresponding diameter of about 10 μm. Given these numbers, 50,000 virions thus represent about 5% of the cell’s volume as shown schematically in Figure 2. In the case of bacteria and the viruses that infect them, a T-phage with ≈50 nm diameter (BNID 105870) shows burst sizes of ≈200 in an E. coli cell, representing ≈2% of the volume. Therefore, the characteristic volume fraction taken up by the viruses in these two very distinct cell types shows a much smaller range (100 fold). This may reflect limits to how much biomass viruses can extract from infected cells. In the marine environment which is often depleted in phosphorus that is mostly required for nucleotides, it was suggested that the DNA sizes of the virus and host govern the virion burst size as the virus utilizes the host DNA building blocks (C. M. Brown et al., J. Mar. Bio. Ass. U.K., 86:491, 2006). The measurements and estimates throughout this vignette raise the very interesting question of what governs the overall burst size, as well as what fraction of the synthesized viral DNA and proteins actually make it into infectious viruses.
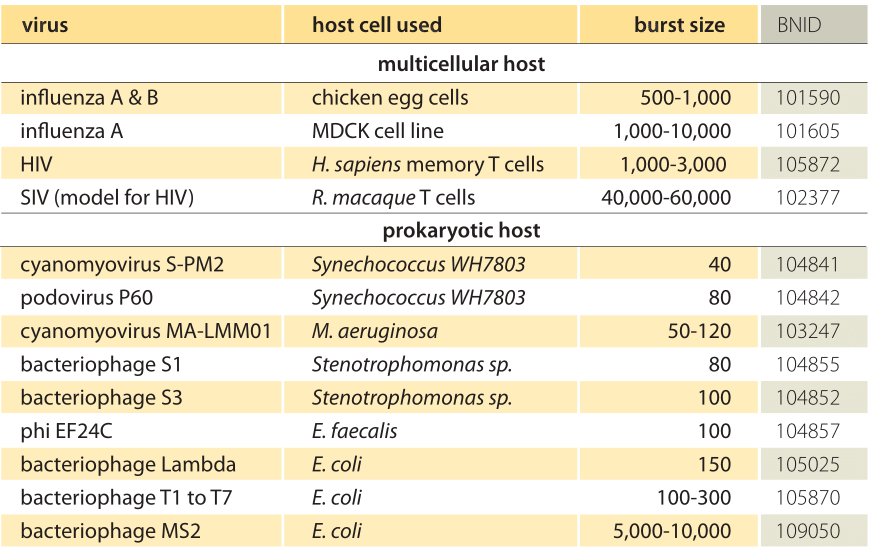
Table 1: Virons burst sizes from various host organisms. Table focuses on contrasting prokaryotes versus mammalian cells