What are the absolute numbers of signaling proteins?
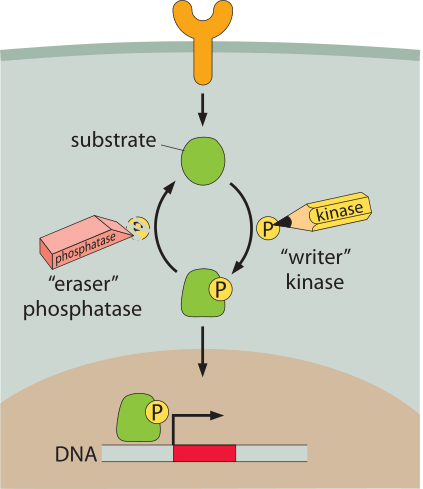
Figure 1: Schematic of a generic signaling network. A membrane receptor at the cell surface (orange) releases a substrate. The substrate is modified by the addition of a phosphate group by a kinase. The addition of the phosphate group localizes the protein to the nucleus (brown) where it then acts as a transcription factor. Removal of the phosphate group is mediated by a phosphatase.
Bacteria move in a directed fashion to regions with more nutrients. Neutrophils, as the assassins of the immune system, chase down bacterial invaders by sniffing out chemical signals coming from their prey. Photoreceptors respond to the arrival of photons by inducing signaling cascades that we interpret as the act of seeing. The cells in developing embryos take on different fates depending upon where they are within the organism. To accomplish these tasks, cells are guided by a host of molecular sentinels whose job is to receive signals about the external world and to make decisions based upon those inputs. The conceptual architecture of the signaling modules that carry out these kinds of responses are indicated schematically in Figure 1. As is clear from this diagram, there are multiple molecular players that implement the response to signals and clearly, the answers to questions about signal amplification, specificity and feedback can all depend upon the number of copies of each of the molecular partners.
One of the conceptual threads that will run through our entire discussion of signaling is that proteins are modified by the addition (“write”) and removal (“erase”) of chemical groups such as phosphate groups or methyl groups. Though we will use this notation in several of the figures in this vignette, the reader should not think that the addition of the group necessarily corresponds to the active form of the modified protein. In many instances, the signaling event corresponds to the removal of a phosphate group and the unphosphorylated conformation is the active form. For example in the case of the chemotaxis signaling molecule CheY, in some organisms the phosphorylated form triggers the motor to change direction whereas in other organisms it is the unphosphorylated form that directs this response. To the best of our knowledge, whether there is an evolutionary advantage to one or the other tactic still awaits clarification.
One of the defining characteristics of signaling proteins is that depending upon environmental conditions, the concentration of the relevant signaling molecule, or of the active form, can vary dramatically. As a result, the very feature of these proteins that makes them most interesting stands in the way of giving a precise and definitive answer to the question of the “generic” number of such signaling proteins within cells. Hence, we adopt the strategy of providing a collection of examples that serve to paint a picture of the relevant ranges of signaling protein concentrations, mindful of the dependence of the resulting census on the conditions that the cell has been subjected to.
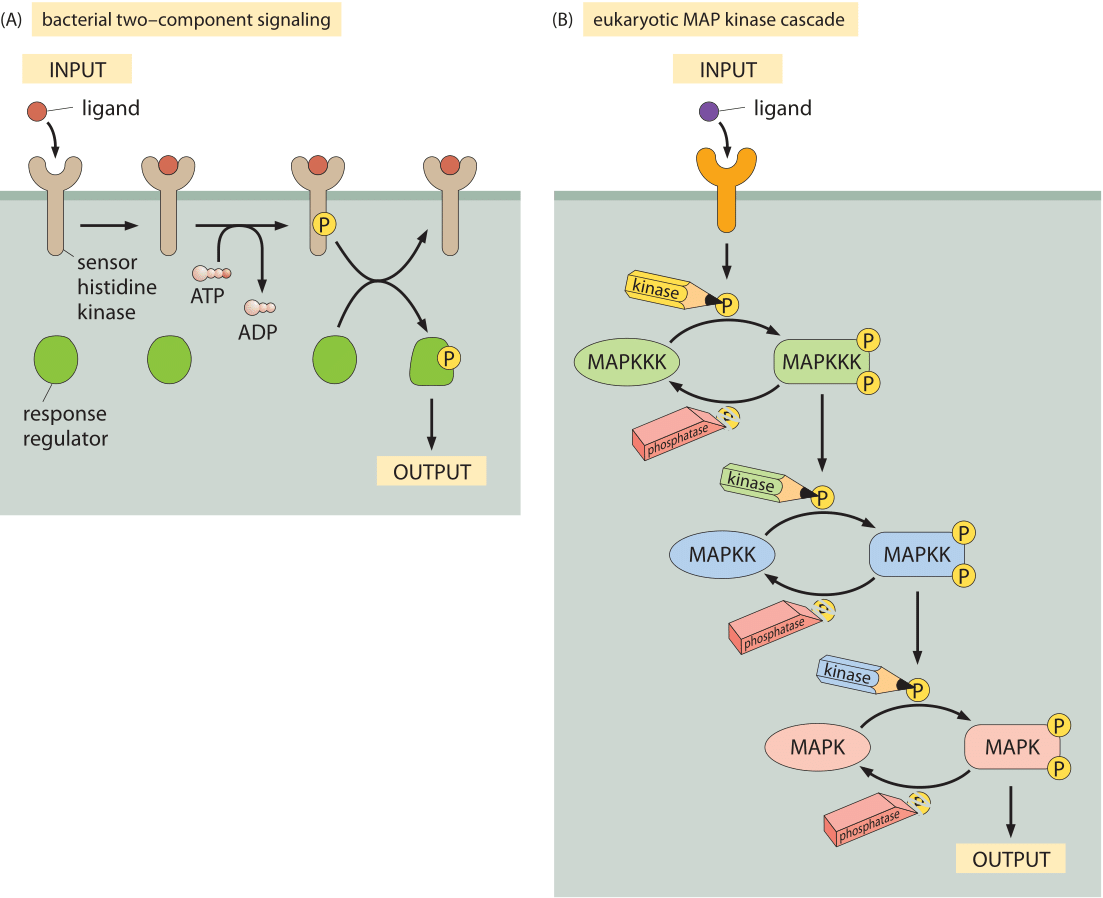
Figure 2: Model signaling pathways. (A) Two-component signaling systems in bacteria. The membrane receptor is a kinase that phosphorylates a soluble messenger molecule that is activated by phosphorylation. (B) MAP-kinase pathway. The MAPKKK phosphorylates the MAPKK which phosophorylates the MAPK molecule which then induces some output.
To provide a quantitative picture of the molecular census of signaling molecules we resort to some of the most celebrated signaling systems as indicated schematically in Figure 2. Perhaps the simplest of cell signaling pathways is found in bacteria and goes under the name of two-component signal transduction systems (see Figure 2A). These pathways are characterized by two key parts: i) a membrane-bound receptor that receives signals from the external environment, but which also harbors a domain (a histidine kinase) on the cellular interior, ii) a response regulator that is chemically modified by the membrane-bound receptor. Often, these response regulators are transcription factors that require phosphorylation in order to mediate changes in gene expression. In E. coli, there are over 30 such two-component systems (BNID 107848). Figure 2B shows a similarly central signal transduction system in eukaryotes known as the MAP-kinase pathway. Like their bacterial counterparts, these pathways make it possible for some external stimulus such as a pheromone or high osmolarity to induce changes in the regulatory state of the cell.
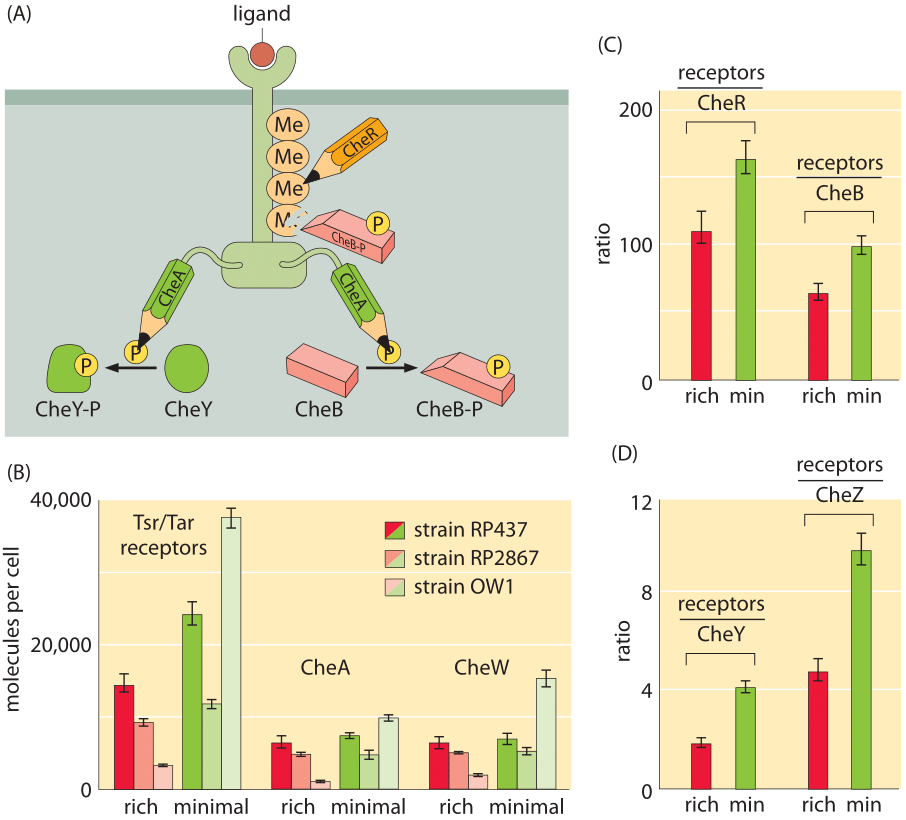
Figure 3: Census of the molecules of the bacterial chemotaxis signaling pathway. (A) Schematic of the molecular participants involved in bacterial chemotaxis. (B) Number of chemotaxis receptor molecules and number of CheA and CheW (which connects the Tsr/Tar receptors to CheA) molecules. Results are shown for different strains and for different growth media. (C) Ratio of number of receptors to CheR and CheB for both rich and minimal media. (D) Ratio of number of receptors to CheY and CheZ (the phosphatase of CheY) for both rich and minimal media. ((B), (C) and (D) adapted from M. Li et al., J. Bact. 186:3687, 2004.)
Probably the most well studied of all bacterial two-component systems is that associated with bacterial chemotaxis. This signaling system detects chemoattractants in the external medium resulting in changes to the tumbling frequency of the motile cells. As will be discussed in the vignette on “What are the physical limits for detection by cells?”, the chemoreceptors have exquisite sensitivity and very broad dynamic range. Figure 3A shows the wiring diagram that implements this beautiful pathway. One of the ways that the stoichiometric census of these signaling proteins is made is using bulk methods in which a population of cells is collected and broken open and their contents allowed to interact with antibodies against the protein of interest. By comparing the amount of protein fished out by these antibodies to those measured using purified proteins of known concentration, it is possible to perform a calibrated measurement of the quantity of protein, such as that reported in Figure 3B for the two-component system relevant to bacterial chemotaxis. Despite as much as a ten-fold difference in the absolute numbers of molecules per cell depending upon strain and growth condition, the relative concentrations of these different molecules are maintained at nearly constant stoichiometric ratios.
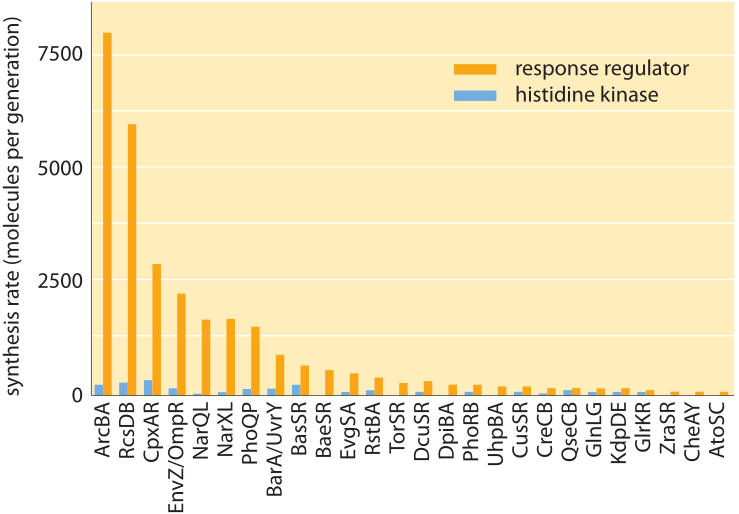
Figure 4: Molecular census for two-component signaling systems in E. coli. These two-component systems consist of a membrane-bound histidine kinase and a soluble response regulator. The figure shows the number of molecules of both the kinase and response regulator for many of the E. coli two-component systems. (Adapted from G.-W. Li et al., Cell 157:624, 2014)
Recent years have seen the emergence of DNA sequencing not only as a genomic tool, but also as a powerful and quantitative biophysical tool that provides a window onto many parts of the molecular census of a cell. Indeed, these methods have been a powerful addition to the arsenal of techniques being used to characterize the processes of the central dogma such as the number of mRNA molecules per cell and the number of proteins. The way these methods work is to harvest cells for their mRNA, for example, and then to sequence those parts of the mRNA that are “protected” by ribosomes. The abundance of such protected fragments provides a measure of the rate of protein synthesis on the gene corresponding to that mRNA. In the context of two-component signaling systems, the molecular census of more than twenty of these systems has been taken using this method known as ribosome profiling. As shown in Figure 4, like with the chemotaxis proteins shown in Figure 2, the histidine kinases usually come with tens to hundreds of copies per cell while their corresponding response regulators come in much higher quantities of about an order of magnitude more molecules per cell.
But why should we care about these absolute numbers? Binding partnerships between different molecular species depend upon their concentrations. Biological action, in turn, often depends upon the binding events that induce conformational change, whether in the context of chemoattractants in the bacterial medium or of acetylcholine and the gating of the ion channels of the nervous system. This suggests that our sole effort should focus on a proper concentration census of the cell. We agree that concentrations should be the top priority; however, we often find that absolute numbers are often a helpful basis for gaining intuition for the cellular milieu, a kind of “feeling for the organism” as phrased by Barbara McClintock, one of the heroines of 20th century genetics. Let’s compare our cognitive capabilities for dealing with concentrations versus absolute numbers. We have all learnt early in life to differentiate between a thousand and a million. We have by now developed an intuition about such values that we do not have in dealing with say μM versus mM. With this familiarity and intuition regarding absolute values we suggest there comes an almost automatic capability to make mental notes of such orders of magnitude. We thus rarely confuse a thousand with a million or a billion whereas we have witnessed many cases where mM was confused with μM or nM. In this spirit we make a point in the next part of this vignette to drive home the rule of thumb we find useful that a characteristic number of copies for many signaling molecules per mammalian cell is about a million, even though 1 μM provides a more biochemically meaningful characterization.

Figure 5: Census of proteins in a yeast signaling system. (A) Schematic of the MAPK pathway associated with the mating response in yeast. (B) Molecular count of the various molecules in the mating response pathway. ((B) adapted from T. M. Thomson, et al., Proc. Nat. Acad. Sci., 108:20265, 2011.)
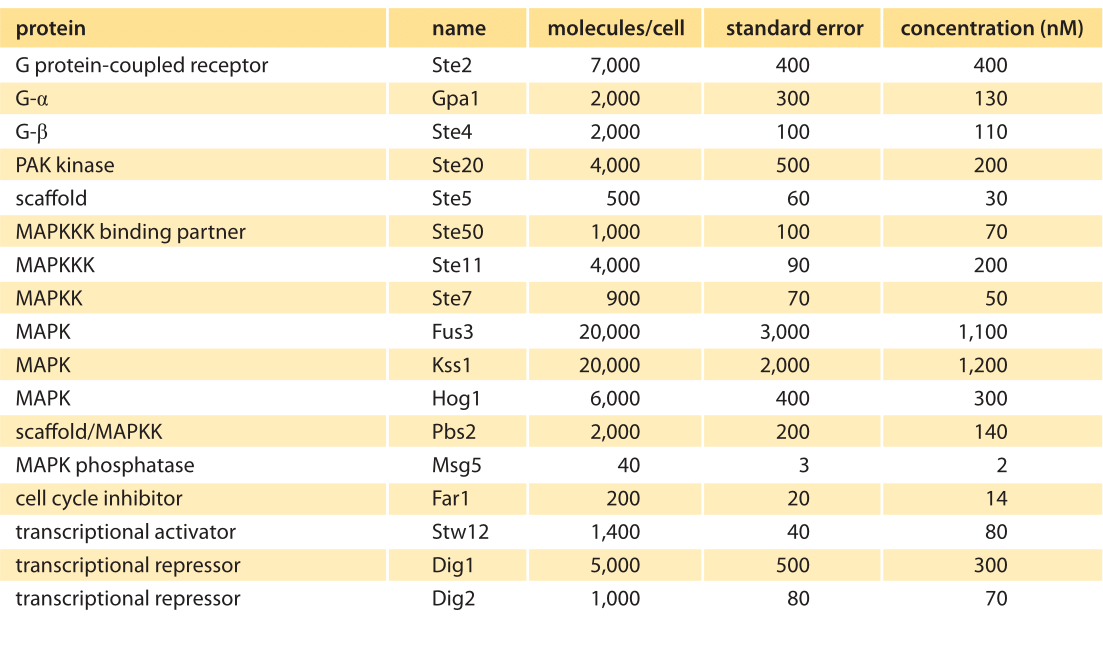
Table 1: Abundances of signaling molecules associated with the MAPK cascade in budding yeast before pheromone addition. Abundances are based on quantitative immunoblotting. Concentration was calculated assuming a cell volume of 29 fL. The standard error indicates the uncertainty on the number of molecules per cell as estimated in this specific experiment. Values were rounded to one significant digit. Adapted from Thomson et al, PNAS 2012 (BNID 107680).
To continue to build this kind of quantitative intuition, we consider another extremely well characterized signaling system found in yeast (see Figure 1B). The process of yeast pheromone mating, the S. cerevisiae version of sexual attraction, employs the so-called MAPK pathway. This pathway in yeast was studied using improved methods of quantitative immunoblotting to measure the cellular concentrations of the relevant molecular players as shown in Figure 5 and Table 1. Copy numbers per cell ranged from 40 to 20,000 with corresponding concentrations in the range 1 nM to 1 μM. Though the budding yeast is 2 orders of magnitude smaller than HeLa cells (the authors used a volume of ≈30 μm3), we see the concentrations tend to be much more similar across organisms. How much do the absolute abundances or concentrations matter for the function of the signaling pathway? The yeast pheromone study shows that the concentration of the scaffolding protein (Ste5, at about 500 copies per cell, ≈30 nM) dictates the cell’s behavior by mediating a tradeoff between the dynamic range of the signaling system and the maximal output response (T. M. Thomson et al., Proc. Nat. Acad. Sci., 108:20265, 2011.).
MAPK pathways are also important in multicellular organisms, providing a model pathway of signal transduction intimately related to growth regulation and many other processes. One of the upstream proteins associated with these pathways is the Ras protein. In HeLa cells and 3T3 fibroblasts this protein was measured to have 104-107 copies under various conditions (BNID 101729). The close to three order-of-magnitude variation reveals a broad range of viable concentrations. Ras interacts with Raf, estimated at about 104 copies per cell, which interacts with Mek at roughly 105-107 copies, which interacts in turn with Erk measured at 106-107, copies. For a HeLa cell with a characteristic median volume of ≈3000 fL, these copy numbers translate into concentrations from ≈10 nM to ≈10 μM assuming a homogenous distribution over the cell volume. Other pathways such as those of Wnt/beta-catenin (BNID 101958) or TGF-beta show similar concentration ranges. An example of an outlier with respect to typical concentrations is Axin in the Wnt/beta-catenin pathway whose concentration is estimated to be in the pM range (BNID 101951). Localization effects can have a dramatic effect by increasing effective concentrations. One example is the import of transcription factors from the cytoplasm to the nucleus where the absolute number does not change but the local concentration increases relative to its value in the cytoplasm by several fold which leads the transcription factor in the nucleus to activate or repress genes without its overall cellular concentration changing. Another example is the effect of scaffolding proteins that hold target proteins in place next to each other thus facilitating interaction as in the MAPK cascade mentioned above. The importance of high local concentration effects led Muller Hill to refer to it as one of the main ingredients of life (B. Müller-Hill, Molecular Microbiology, 60:253, 2006). These and more recent studies highlight that it is not only the average concentration or absolute numbers that matter, but rather how these signaling proteins are spatially organized within the cell (BNID 110548).
One of the important conclusions to emerge from these studies is an interesting juxtaposition of large variability in overall numbers of signaling molecules depending upon both strain and growth conditions coupled with a roughly constant ratio of the individual molecular players. Very often it is found that a fold change in the concentration is the key determinant of the underlying function and the property to which the circuits of signal transduction seem to be tuned. Though cell-to-cell variably will often show a 2-fold difference in absolute value, a temporal change of 2 fold in the ratio of components will be quickly detected and elicit a strong response. Numbers like those described here call for a theoretical interpretation, which will provide a framework to understanding, for example, the relative abundances of receptors and their downstream partners.