What are the copy numbers of transcription factors?
Transcription factors are the protein sentinels of the cell, on the lookout to decide which of the many genes hidden within the DNA should be turned into an mRNA message at a given time. On the order of 200-300 distinct kinds of transcription factors (i.e. coded by different genes) exist in model bacteria such as E. coli (BNID 105088, 105089), with »1000 distinct kinds in animal cells (BNID 105072, 109202). Those enamored with simple model biological systems, will delight to learn of parasites such as mycoplasma pneumoniae or buchnera aphidicola that seem to have only 4 distinct transcription factors (BNID 105075). Transcription factors are key players in regulating the protein composition of the cell which they often do by binding DNA and actively interacting with the basal transcription apparatus, either activating or repressing transcription. Because they are prime regulators they have been heavily studied, but in stark contrast to their ubiquity in published papers, their actual concentrations inside cells are usually quite low. Their concentration depends strongly on the specific protein, cell type and environmental conditions, but as a rule of thumb, the concentrations of such transcription factors are in the nM range, corresponding to only 1-1000 copies per cell in bacteria or 103-106 in mammalian cells. This is in stark contrast to the most abundant proteins such as glycolytic proteins or elongation factors which will tend to occur with many thousands of copies in bacteria and many millions in mammalian cells. Not surprisingly, the cellular concentrations of transcription factors are often comparable to the Kds of these proteins for DNA binding. Often, those transcription factors that occur at lower concentrations are specific and engaged in regulating only a few genes (e.g. LacI regulating the lactose utilization operon), whereas those at higher concentrations have many genes as their targets and are sometimes known as global regulators (e.g. the protein CRP which modulates carbon source utilization in bacteria).
Given the central role the Lac repressor (LacI) plays in undergraduate molecular biology courses as the paradigm of gene regulation, it might come as a surprise that it usually appears with only about 10 tetrameric copies per cell (equivalent to a concentration of »10 nM, BNID 100734). Interestingly, non-specific affinity to the DNA causes »90% of LacI copies to be bound to the DNA at locations that are not the cognate promoter site and only at most several copies to be freely diffusing in the cytoplasm (both forms are probably important for finding the cognate target as has been shown in elegant theoretical studies). Further, these small copy numbers have inspired important questions about how living cells manage (or exploit) inevitable stochastic fluctuations that are associated with such small numbers. For example, if the partitioning of these proteins upon cell division is strictly random, with such small numbers there is a chance that some daughter cells will be without a copy of some transcription factor at all.
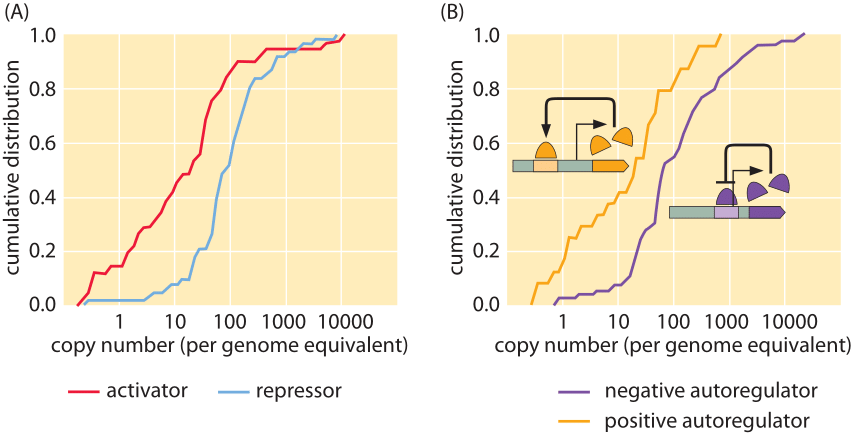
Figure 1: Measured copy numbers of transcription factors in E. coli. (A) Cumulative distributions for both activators and repressors showing that activators typically occur between 1 and 100 copies per cell whereas repressors generally occur between 10-1000 copies per cell. (B) Cumulative distributions for autoregulators. (adapted from G.-W. Li et al, Cell 157, 624–635, 2014)
Though LacI is the model transcription factor, most transcription factors show higher concentrations of tens to hundreds of nM as can be seen in Figure 1 (BNID 102632, 104515). The results shown in the figure were obtained using a beautiful recent method which is one of several that has turned DNA sequencing into a legitimate biophysical tool for performing molecular censuses. In this case, the idea is that fragments of mRNA that have been protected by translating ribosomes are sequenced. The density of these ribosomal footprints tells us something about the rate of protein synthesis, which through careful calibrations makes it possible to quantify the number of proteins per cell. There are many interesting nuances associated with this data. For example, as shown in the figure, the distributions of copy numbers of activators and repressors are different with activators on average having lower copy numbers than repressors. A second intriguing observation that emerges from these proteome-wide results is the observation that transcription factors that are subject to allosteric control by ligand binding have on the average much higher copy numbers than those that are ligand independent.
Even more effort than in the bacterial case has been invested in what is arguably the most studied protein of all time, p53 (with another key contender being hemoglobin), a transcription factor that is claimed to be involved in over 50% of cases of cancer (BNID 105092). Its name, like many other proteins, arises from its original characterization in gels, where it migrated as a protein of mass 53 kDa. Today we know it actually has a mass of 44 kDa, and its slow migration is due to many bulky proline residues, but the name persists. This critical transcription factor helps mediate the decision of a cell to perform programmed cell death versus continued proliferation, critically affecting tumor growth. It has a characteristic concentration of »100 nM (corresponding to »100,000 molecules in a mammalian MCF7 breast cancer cell line, BNID 100420). Transcription factors modulate transcription by changing their binding properties to DNA through interaction with signals coming from receptors, for example. Mutations in the DNA of cancer cells change p53 binding properties to the downstream genes it regulates, often stopping cell death from occurring, thus leading to uncontrolled growth.
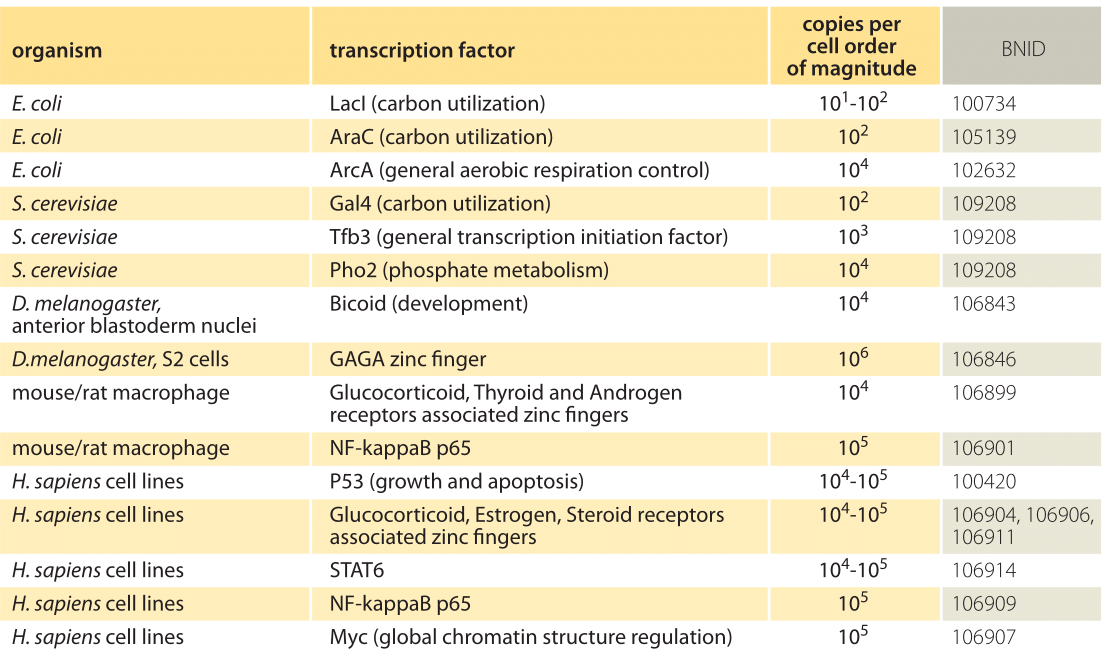
Table 1: Absolute copy numbers from a number of different organisms. Values are rounded to closest order or magnitude. For more values see M. D. Biggin, Dev. Cell, 21:611, 2011 (BNID 106842).
Table 1 gives examples of the census of a variety of other transcription factors and an order-of-magnitude characterization of their absolute copy numbers. Given that transcription factors are such a big part of the daily life of so many researchers, this table aims to make it easier to develop intuitive rules of thumb for quantitative analysis. What can the absolute numbers or concentrations teach us? They are essential when we want to analyze the tendency for sequestering of transcription factors in complexes or inhibition by regulators, or to consider the effect of non-specific binding to DNA or to reckon the response time for triggering a transcriptional program, since in each of these cases the formation of molecular partnerships depends upon the concentrations of the relevant molecular actors. We advocate keeping characteristic orders of magnitude such as those shown in the table at one’s disposal, but we also remember that the number of such factors often varies both in space and time. This is especially clear in the case of developmental patterning where often it is the spatial variation in transcription factor concentrations that lays down the patterns that ultimately become the body plan of the animal. For example, the gradient along the anterior-posterior axis of the fly embryo of the transcription factor bicoid (shown in the table) is a critical ingredient in the patterning of the fly, with similar proteins shaping we humans starting from so simple a beginning as the uniting of an egg and a sperm.