What are the most abundant proteins in a cell?
Even after reading several textbooks on proteins, one may still be left wondering which of these critical molecular players in the life of a cell are the most quantitatively abundant. Many of the biochemical and regulatory pathways that make up the life of a cell have been or are now being mapped with exquisite detail and many of the nodes have essential roles. But a wiring diagram does not a cell make. To really understand the relative rates of the various components of these pathways, we need to know about the abundances of the various proteins and their substrates. Further, if one is interested in assessing the biosynthetic burden of these various molecular players, the actual abundance is critical. Similarly, the many binding reactions that are the basis for much of the busy biochemical activity of cells, whether specific binding of intentional partners or spurious nonspecific binding between unnatural partners is ultimately dictated by molecular counts.
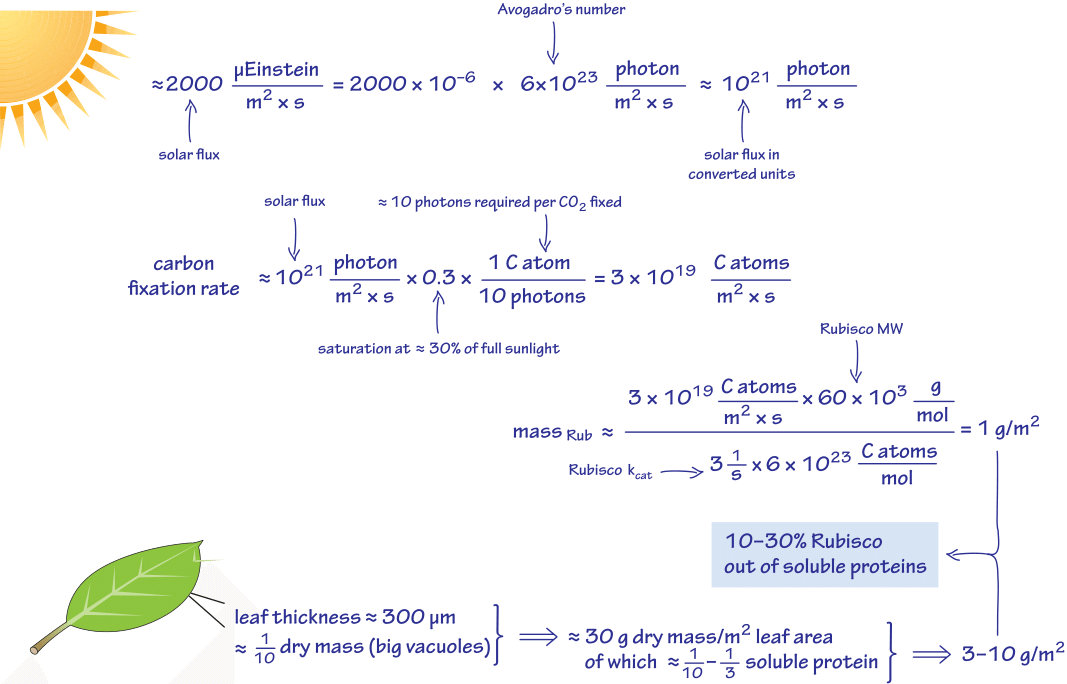
Figure 1: Estimate of the fraction of Rubisco proteins of total protein content in a leaf cell.
We begin with a consideration of the molecular census of the carbon-fixing enzyme Rubisco, the molecular gatekeeper between the inorganic and the organic worlds. This key molecular workhorse is required at extremely high concentrations. Let’s see how much and why. As schematically depicted in Figure 1, the photon flux under full sun illumination that can be used to excite photosynthesis is about 2000 microEinstein/(m2 x s). An Einstein is a unit referring to one mole of photons. About 30% of this flux is maximally utilized and beyond that there is saturation of the photosynthetic apparatus. About 10 photons are required to supply the energy and reducing power to fix one carbon atom. A Rubisco monomer has a mass of 60 kDa (BNID 105007) and works at a relatively sluggish maximal rate of ≈1-3 per sec per catalytic site. Combining these facts as done in Figure 1 we find that the cell needs ≈1-3 g/m2. Let’s estimate the total protein content in a leaf. A characteristic leaf has a height of about 300 micron. The dry mass occupies ≈10% (BNID 107837, 110839) as there are big water filled vacuoles that take up most of the leaf volume while giving it a large area for light interception. So we arrive at about 30 g/m2 of dry weight. Say the soluble proteins are about one third of the total dry mass this leads to about 10 g/m2 (BNID 107837, 107403). Given the value above of 3 g/m2 of Rubisco we conclude that about one third of the soluble protein mass needs to be Rubisco. Indeed, the experimental determinations in C3 plants such as wheat, potato and tobacco find that Rubisco constitutes in the range of 25-60% of all soluble proteins in leaf cells (BNID 101762).
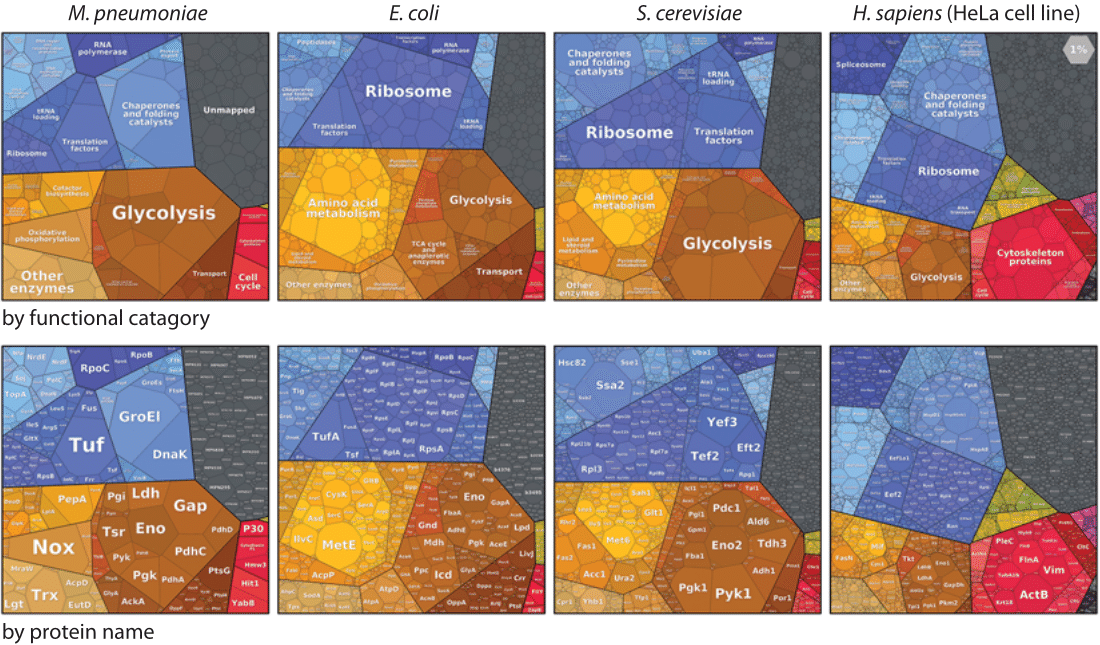
Figure 2: Proteomaps, a hierarchical presentation of the composition of a proteome using Voronoi treemaps. Each protein is associated with a polygon whose size is proportional to the abundance of that protein, thereby emphasizing highly expressed proteins. Functionally related proteins are placed in common subregions to show the functional makeup of a proteome at a glance. Shown are four model cells, the HeLa cell line was chosen for H. Sapiens. Upper row: depiction by functional category, lower row: depiction by protein name. The proteome was measured under relatively rapid exponential growth. Adapted from W. Liebermeister et al, Proc. Natl. Acad. Sci., 111:8488, 2014.
What about other organisms? In the late 1970s, a unique catalog of the quantities of 140 proteins under different growth rates in E. coli was created using 2D gel electrophoresis and 14C labeling (BNID 106195). Newer methods have recently enabled extensive protein wide surveys of protein content using mass spectrometry, TAP labeling (BNID 101845) and fluorescent light microscopy (BNID 106257). A database (http://pax-db.org/) has been exploited to collect such data on protein abundances across organisms. Visualization of such data can be performed using Voronoi treemaps as shown in Figure 2 (for visualization of more datasets see www.proteomaps.net). The picture emerging from these kinds of experiments shows several prominent players. Not surprisingly, ribosomal proteins and their ancillary components are highly abundant. The elongation factor EF-TU, responsible for mediating the entrance of the tRNA to the free site of the ribosome, was characterized as the most abundant protein in the original 1978 catalog with a copy number of ≈60,000 proteins per bacterial genome. The reason values were given on a per genome basis rather than per cell was in order to take into account the increase in cell size with growth rate. Because the number of genome copies scales roughly as the cell volume, using that as a basis corrects for such effects. This absolute molecular count can be repackaged in concentration units using the rule of thumb shown in the appendix on tricks of the trade of one molecule per bacterial cell volume being about 1 nM in concentration. Such a conversion leads to roughly a concentration of 100 μM for this important protein (BNID 104733). Recall that under different growth conditions, the cell size and thus total protein content can change several fold (see, for example, the vignette on yeast size) and this growth rate dependence of the protein census is especially important for ribosomal proteins.
Another contender for the title of most abundant protein is ACP, the Acyl carrier protein, which plays an important role in fatty acid biosynthesis. This protein carries fatty acid chains as the chains are elongated. It is claimed to be the most abundant protein in E. coli, with about 60,000 molecules per cell (BNID 106194). In a recent high throughput mass spectrometry measurement on minimal medium (BNID 104246), a value of ≈80,000 was reported making it the third most abundant protein reported. The most abundant protein found in this particular survey of E. coli is RplL, a ribosomal protein (estimated at ≈110,000 copies per cell, which exists in 4 copies per ribosome in contrast to other ribosomal proteins which have one copy per ribosome) and TufB (the elongation factor also known as EF-TU, estimated at ≈90,000 copies per cell). The next most abundant reported proteins are a component of the chaperone system Gro-EL-Gro-ES necessary for proper folding of many proteins and GapA, a key enzyme in glycolysis.
Indeed looking at a comparative functional view of protein abundance across several cell types the proteins of glycolysis are the dominant fraction in the budding yeast (about a quarter of the proteome in rich medium). Glycolysis serves as the backbone of energy and carbon metabolism and the mass flux it carries is the largest in the cell.
Structural proteins can also be highly abundant. FimA is the major subunit of the 100-300 fimbria (pili) of E. coli (BNID 101473) used by sessile bacteria in the transition to stationary phase. Every pilus has about 1000 copies (BNID 100107) and thus a simple estimate leads us to expect hundreds of thousands of this repeating monomer on the outside of the cell. In vertebrate cells, actin, sometimes accounting for 5-10% of protein content, is often at the top of the list.
As noted above, protein content varies based on growth conditions and gene induction. For example, LacZ, the gene responsible for breaking lactose into glucose and galactose is usually repressed and the protein has only a small number of copies (10 to 20, BNID 106200), but under full induction was characterized to have a concentration of 50uM (BNID 100735), i.e. about 50,000 copies per cell.
If one looked at the sum total over all organisms, what would we find is the most abundant protein on earth? This title is usually ascribed to Rubisco. Indeed it carries out the task of fixing carbon that is done on such a massive scale across the planet and supports all actions of the biosphere. Yet in working on this book we had second thoughts. In a paper we wrote (R. Phillips & R. Milo, Proc. Natl. Acad. Sci., 106:21465, 2010) we tried to give a sense of the ubiquity of Rubisco by normalizing it on a per person basis. This gave about 5 kg of Rubisco protein per person (though clearly Rubisco, though supporting us, is not physically in humans). Now in several reports, collagen, a connective tissue protein that is localized extracellularly, was found to account for about 30% of the protein mass in humans (BNID 109730, 109731). In a 70 kg human with 2/3 water and half of the rest protein, this gives about 10 kg total protein suggesting as much as 3 kg collagen. That might be a somewhat inflated value but then collagen is not only in humans. What is the largest biomass of animals on earth? It is actually our livestock in the form of cows, pigs, poultry etc. at a total mass of about 100 kg per person (BNID 111482, more than 20 times the mass of all wild land mammals!). Livestock having a similar collagen concentration to human (BNID 109821), these numbers point out that collagen should displace Rubisco as the titleholder for the most abundant protein on earth. Even for the title in the category of catalytic proteins, rather than “boring” structural proteins, the race is still open. Given the immense mass of bacteria on earth and the accumulating proof from proteomics and metagenomics for the ubiquity of glycolytic proteins, they are also prime contenders for the title of the most abundant protein.