What are the rates of cytoskeleton assembly and disassembly?
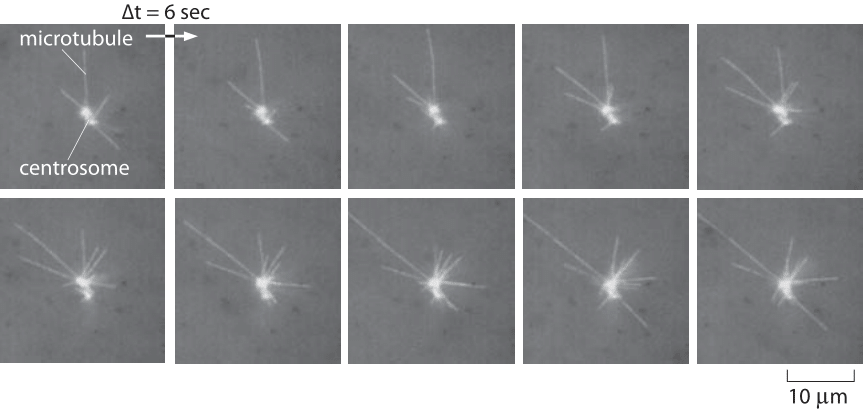
Figure 1: Snapshots of the dynamics of microtubules. This series of snapshots comes from a Xenopus egg extract which makes it possible to reconstitute microtubule dynamics. The time interval between images is 6 seconds. Note that individual filaments both grow and shrink with a characteristic half-life of a little less than a minute. (Adapted from R. Tournebize et al., The EMBO Journal Vol.16 No.18 pp.5537–5549, 1997.)
What is it that makes the polymers of the cytoskeleton so different from the polymers that make up the plastic bags and containers that fill our stores and the nylon in the clothes we wear? Above all, it is their fascinating and counterintuitive dynamics that makes cytoskeletal filaments such as actin and microtubules so distinct from the polymers of the industrial age. To get an idea of this complex dynamics, we need only consider the defining act of individual cells as they divide to become two new daughters. The microtubules in the mitotic spindle of dividing cells are engaged in a constant dance as they grow and shrink over and over again (see Figure 1). Similarly, the actin at the leading edge of motile cells also engages in an incessant parade of nucleation, branching, growth and depolymerization. In this vignette, we take stock of the rates associated with the assembly and disassembly of these biological polymers, with the numbers discussed here serving to provide insights in contexts ranging from the timing of metaphase in the cell cycle to the speed with which motile cells can move across surfaces.
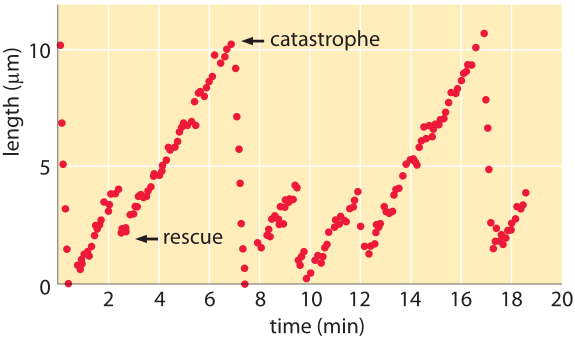
Figure 2: Microtubule length vs time. The length of microtubules as a function of time reveals periods of growth punctuated by catastrophes in which the filaments rapidly depolymerize. (Adapted from D. K. Fygenson et al., Phys. Rev. E50:1579, 1994.)
If we are to look down a microscope at fluorescently labeled microtubules we will see that these filaments perform a bizarre series of growth and shrinkage events as shown in the snapshots from a video microscopy study of the dynamic instability in Figure 1. From a quantitative perspective, one can monitor the length of microtubules as a function of time. Snapshots from a video like those shown here lead us to recognize four key parameters characterizing microtubule dynamics: the growth and shrinkage rates themselves as well as the rates at which the microtubules transition between growth and shrinkage phases. As seen in the data in Figure 2, such time courses allow us to immediately read off approximate values for the in vitro rates characterizing both growth and shrinkage of these polymers. To be concrete, we note that for the data shown in that figure, the microtubule grows roughly 8 μm over a time of approximately 4 minutes corresponding to a growth rate of 2 μm/min ≈ 30 nm/s. These numbers remind us of the timing of the cell cycle where mitosis takes several tens of minutes, consistent with this 2 μm/min polymerization rate where we see that to move chromosomes over distances of several tens of microns should take tens of minutes. Further, if we recall from the vignette on “What are the sizes of the cell’s filaments?” that the size of a monomer is of order 5 nm, this means that the growth rate is roughly 5-10 monomers added per second. Since a microtubule is comprised of thirteen protofilaments, we need to multiply this 5-10 monomers per second by a factor of 13 resulting in a net addition rate of roughly 100 monomers per second at the growing end of a microtubule.
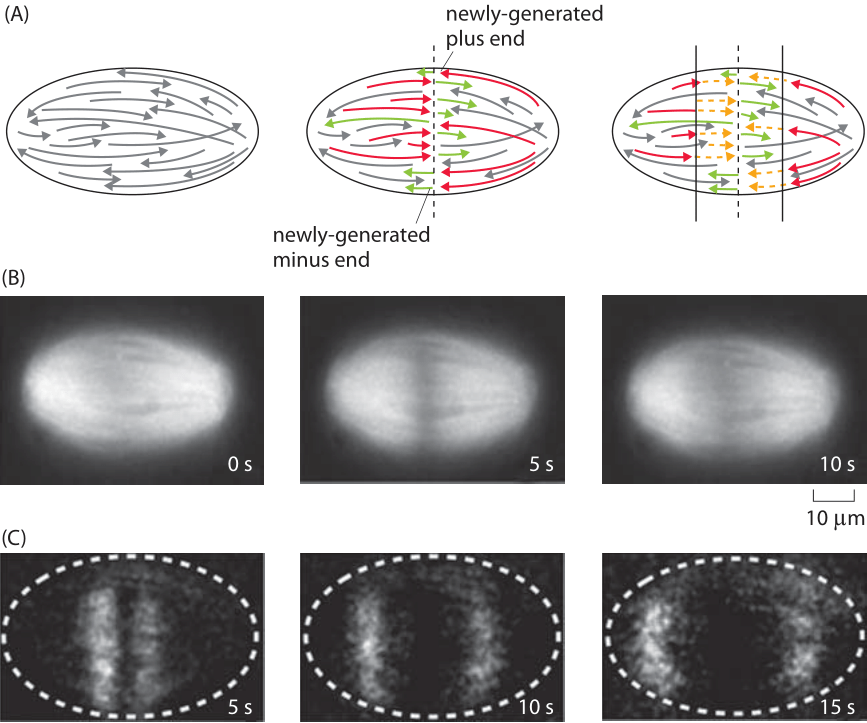
Figure 3: Measuring the rate of microtubule depolymerization in the mitotic spindle. (A) Schematic of the microtubules before and after the cut. The newly formed plus ends are then subject to depolymerization which can be visualized fluorescently. (B) (C) (Adapted from J. Brugues et al., Cell 149:554, 2012.)
What about the in vivo rates of microtubule dynamics? Recent experiments on the dynamics of chromosome segregation by the mitotic spindle have been carried out in extracts of eggs from the frog Xenopus laevis. The idea of this experiment is that by cutting the microtubules using a laser as shown in Figure 3A, one can watch and measure the resulting dynamics as the newly formed plus ends shrink by depolymerization. The experiment is revealed in Figure 3, which shows an example of the dynamics after the spindle is cut. The measured rate of depolymerization is 35±2 μm/min. This rate corresponds to roughly 500 nm/s. If we recall that each monomer is roughly 5 nm in size, this means that one protofilament on a given microtubule is losing roughly 100 monomers every second. Since there are 13 protofilaments per microtubule, the total loss rate from a shortening microtubule is roughly 1000 monomers per second.
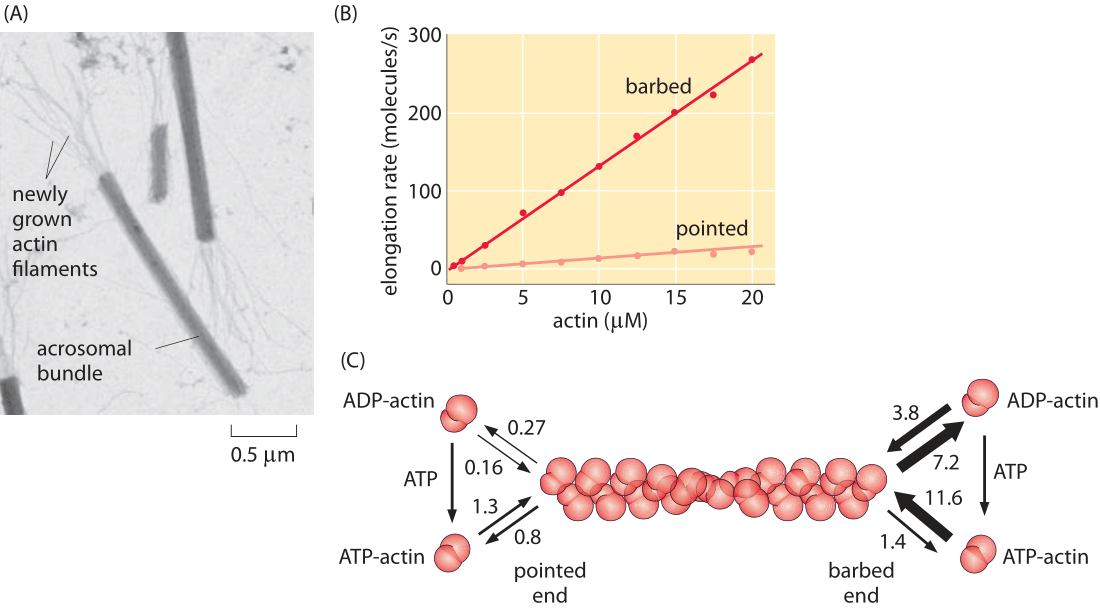
Figure 4: Measuring the rate constants for actin filament polymerization. (A) Electron microscopy image showing the structures used to determine the rates at both the barbed and pointed ends. (B) The actin monomer concentration in μM is shown next to each time course. (C) Rate constants for both ATP and ADP actin. On rates have units of μM-1 s-1 while off rates have units of s-1. Note the large asymmetry in rates between the barbed and pointed ends. (A, courtesy of M. Footer; B, C, adapted from T. D. Pollard, J. Cell Biol. 103:2747, 1986.) (RP: numbers are all messed up – need to be fixed here and in PBOC)
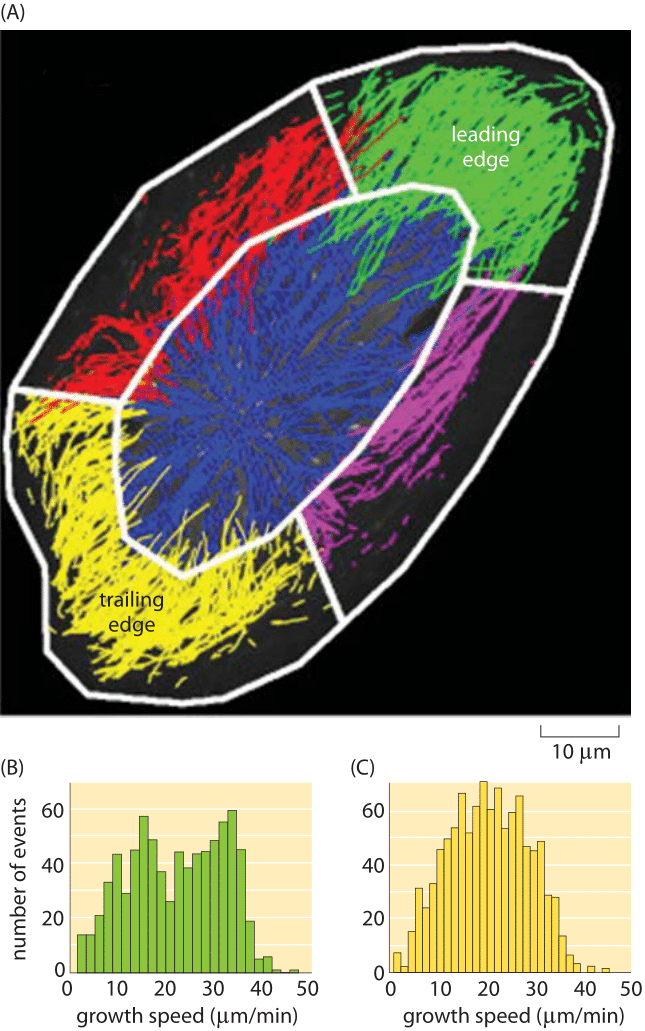
Figure 5: Growth rates of actin filaments in vivo. (A) Growth rates in different regions of a human endothelial cell. (B) Growth speeds at the leading edge of the cell. (C) Growth speeds at the trailing edge of the cell. (Adapted from KT Applegate, Journal of Structural Biology 176 (2011) 168–184)
Just as microtubules exhibit the dynamic instability that leads to periods of growth and shrinkage, actin filaments too are subject to an array of interesting dynamics. The simplest way to characterize the important character of the dynamics of polymerization and depolymerization in actin is to note that there is a structural asymmetry between the two ends of the filament. This dictates that the rate of monomer addition and loss on the two ends is different, a fact that is central to their intriguing dynamics. One of the earliest efforts to parameterize the different rate constants on the two ends was a tour de force study using electron microscopy where the lengths of actin filaments were measured as a function of time after incubation at various actin concentration. The resulting data from that experiment is shown in Figure 4 which reveals the striking asymmetry in rate constants on the two ends (barbed and pointed), and further, how these rates depend upon whether the actin is bound to ATP or ADP.
Actin is a key participant in cell motility as we have already seen in several other vignettes. How do the in vitro rates described above compare to what is seen in living cells? Sophisticated image analysis tools have made it possible to watch the dynamics of all of the many filaments within a motile cell simultaneously as shown in Figure 5. Note that the results of this in vivo study using fluorescence microscopy are remarkably consistent with the in vitro rates reported in Figure 4. Specifically, if we look at the growth rate in Figure 4 for barbed ends and extrapolate the change in length over a minute time scale, we see that the growth rates are tens of μm/min, consonant with the fluorescence studies, a happy self-consistency between widely different methods.
Cytoskeletal filaments are also key players in the dynamics of bacteria. One of the most interesting case studies is the ParM system that is responsible for segregation of bacterial plasmids prior to cell division. In schematic form, it is thought that the way these polymers work is that each extremity of the growing polymer is attached to a plasmid and as the polymer grows across the cell, it pushes the two plasmids to the different future daughter cells. As seen in Figure 6, the rate of ParM polymerization in vitro can be estimated by noting that the length increases by several microns over a minute time scale resulting in a growth rate of several μm/min. Structurally, ParM is essentially indistinguishable from actin, though its role in segregation of DNA as well as the fact that it exhibits a dynamic instability, shown in Figure 6B, which makes it occupy a conceptual middle ground between actin and microtubules.
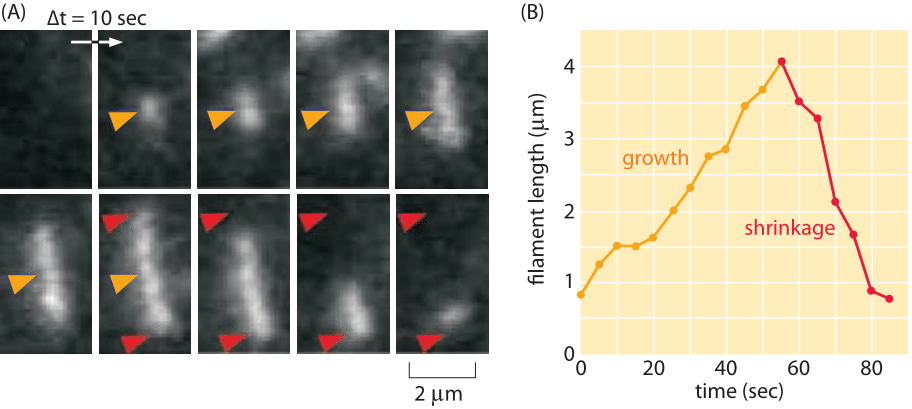
Figure 6: Dynamics of ParM. (A) At the beginning of the film strip, the filament of ParM is growing. The red arrows indicate the terminal ends of the filament and provide a fiducial marker for evaluating filament shrinkage. (B) The graph shows the length of a filament as a function of time. (Adapted from E.C. Garner et al., Science 306:1021, 2004.)