What is faster, transcription or translation?
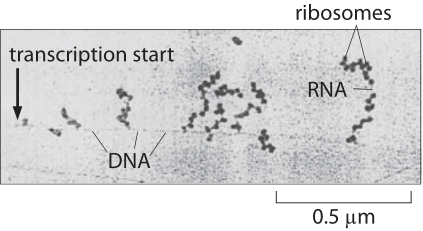
Figure 1: Electron microscopy image of simultaneous transcription and translation. The image shows bacterial DNA and its associated mRNA transcripts, each of which is occupied by ribosomes. (Adapted from O. L. Miller et al., Science 169:392, 1970.)
Transcription, the synthesis of mRNA from DNA, and translation, the synthesis of protein from mRNA, are the main pillars of the central dogma of molecular biology. How do the speeds of these two processes compare? This question is made all the more interesting as a result of observations like those shown in Figure 1, namely, the existence of the beautiful “Christmas tree” structures observed in E. coli using electron microscopy. These stereotyped structures reflect the simultaneous transcription and translation of the same gene and raise the question of how the relative rates of the two processes compare making such synchronization of these two disparate processes possible.
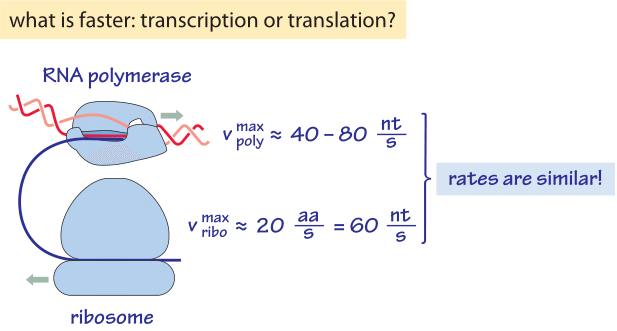
Figure 2: Back of the envelope calculation comparing the rates of transcription and translation showing they are effectively very similar. nt denotes nucleotides, i.e. bases.
Transcription of RNA in E. coli of both mRNA and the stable rRNA and tRNA, is carried out by ≈1000-10,000 RNA polymerase molecules (BNID 101440) proceeding at a maximal speed of about 40-80 nt/sec as shown in Table 1 (BNID 104900, 104902, 108488). Translation of proteins in E. coli is carried out by ≈10,000-100,000 ribosomes (BNID 101441) and proceeds at a maximal speed of about 20 aa/sec as shown in Table 2 (BNID 100059, 105067, 108490). Interestingly, since every 3 base pairs code for one amino acid, the rates of the two processes are nearly matched as schematically shown in Figure 2 (see also BNID 108487). If translation was faster than transcription, it would cause the ribosome to “collide” with the RNA polymerase in prokaryotes where the two processes can happen concurrently. Such co-transcriptional translation has become textbook material through images such as Figure 1. But recent single-molecule microscopy shows this occurs relatively rarely and most translation is not coupled with transcription in E. coli (S. Bakshi et al., Mol Microbiol. 85:21, 2012). Rather, most translation takes place on mRNA that has already diffused away from the DNA rich nucleoid region to ribosome-rich cytoplasmic regions. The distribution of ribosomes in the cells is further shown in the vignette on “How many ribosomes are in a cell?”. In another twist and turn of the central dogma, it was shown that ribosomes can be important for fast transcription in bacteria (S. Proshkin et al., Science 328:504, 2010). The ribosomes seem to keep RNA polymerase from backtracking and pauses, which can otherwise be quite common for these machines, thus creating a striking reverse coupling between translation and transcription.
Table 1. Transcription rate measured across organisms and conditions. All values measured at 37°C except D. melanogaster measured at 22°C.
Table 2: Translation rate measured across organisms and conditions. All values measured at 37°C except for S. cerevisiae and N. crassa measured at 30°C.
What do the relative rates of transcription and translation mean for the overall time taken from transcription initiation to synthesized protein for a given gene? In bacteria, a one kb gene should take at maximal transcription rate about 1000 nt/80 nt/s ≈ 10s and translation elongation at maximal speed roughly the same. We note that the total time scale is the sum of an elongation time as above and the initiation time, which can be longer in some cases. Recently it was observed that increasing the translation rate, by replacing wobble codons with perfect matching codons, results in errors in folding (P. S. Spencer et al, J. Mol. Biol., 422:328, 2012). This suggests a tradeoff where translation rate is limited by the time needed to allow proper folding of domains in the nascent protein.
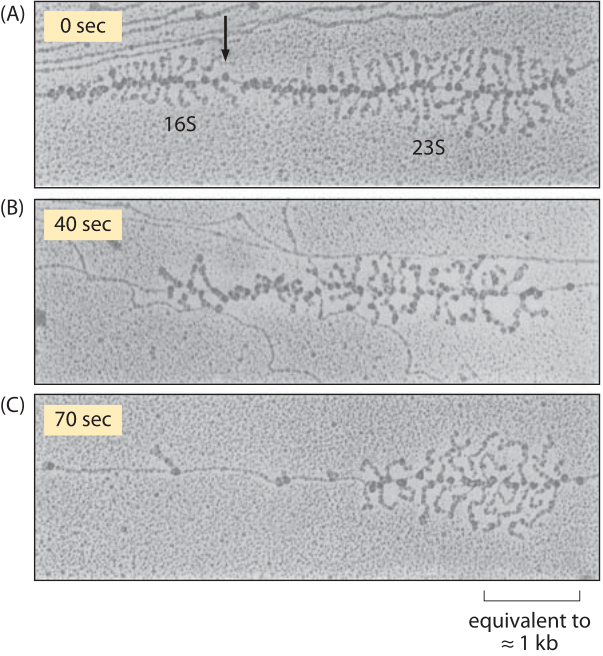
Figure 3: Effect of rifampin on transcription initiation. Electron micrographs of E. coli rRNA operons: (A) before adding rifampin, (B) 40 s after addition of rifampin, and (C) 70 s after exposure. After drug treatment, no new transcripts are initiated, but those already initiated are carrying on elongation. In parts (A) and (B) the arrow indicates the site where RNaseIII cleaves the nascent RNA molecule producing 16S and 23S ribosomal subunits. RNA polymerase molecules that have not been affected by the antibiotic are marked by the arrows in part (C). (Adapted from L. S. Gotta et al., J. Bacteriol. 20:6647, 1991.)
How are the rates of these key processes of the central dogma measured? This is an interesting challenge even with today’s advanced technologies. Let’s consider how we might attack this problem. One vague idea might be: “let’s express a GFP and measure the time until it appears”. To see the flaws in such an approach, check out the vignette on “What is the maturation time for fluorescent proteins?” (short answer – minutes to an hour), which demonstrates a mismatch of time scales between the processes of interest and those of the putative readout. The experimental arsenal available in the 1970’s when the answers were first convincingly obtained was much more limited. Yet, in a series of clever experiments, using electron microscopy and radioactive labeling these rates were precisely determined (Miller et al., Science 169:392, 1970; R. Y. Young & H. Bremer, Biochem. J., 152:243, 1975). As will be shown below, they relied on a subtle quantitative analysis in order to tease out the rates.
Measurements on transcription rates were based upon a trick in which transcription initiation was shut down by using the drug rifampin. Though no new transcription events can begin, those that are already under way continue unabated, i.e. rifampin inhibits the initiation of transcription, but not the elongation of RNA transcripts. As a result, this drug treatment effectively begins the running of a stopwatch which times how long since the last transcription process began. By fixing the cells and stopping the transcription process at different times after the drug treatment and then performing electron microscopy, resulting in images like that shown in Figure 3, it was possible to measure the length of RNA polymerase-free DNA. By taking into account the elapsed time since drug treatment the rate at which these polymerases are moving is inferred.
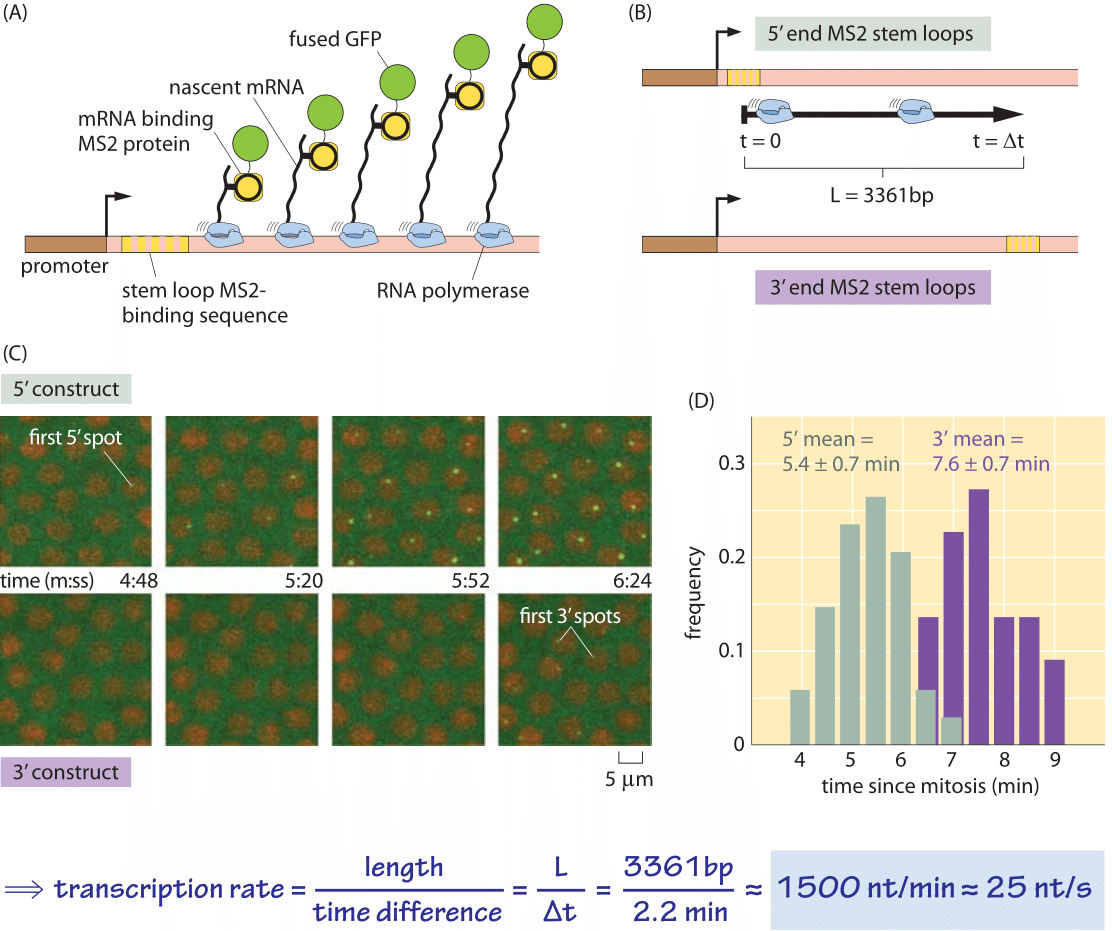
Figure 4: Dynamics of transcription in the fly embryo. (A) Schematic of the experiment showing how a loop in the nascent RNA molecule serves as a binding site for a viral protein that has been fused to GFP. (B) Depending upon whether the RNA loops are placed on the 5’ or 3’ end of the mRNA molecule, the time it takes to begin seeing GFP puncta will be different. The delay time is equal to the length of the transcribed region divided by the speed of the polymerase. (C) Microscopy images showing the appearance of puncta associated with the transcription process for both constructs shown in (B). (D) Distribution of times of first appearance for the two constructs yielding a delay time of 2.2 minutes, from which a transcription rate of 25 nt/s is inferred. Measurements performed at room temperature of 22OC. (adapted from H. G. Garcia, et al., Current Biology, 23, 2140–2145, 2013.)
The measurement of translation rates similarly depended upon finding an appropriate stopwatch, but this time for the protein synthesis process. The crux of the method is the following: start adding labeled amino acid at time zero and follow (“chase” as it is often called) the fraction of labeled protein of mass m as defined by looking at a specific band on a gel. Immediately after the pulse of labeled amino acids one starts to see proteins of mass m with radioactive labeled amino acids on their ends. With time, the fraction of a given protein mass that is labeled will increase as the chains have a larger proportion of their length labeled. After a time τm, depending on the transcript length, the whole chain will be labeled, as these are proteins that began their translation at time zero when the label was added. At this time one observes a change in the accumulation dynamics (when appropriately normalized to the overall labeling in the cell). From the time that elapsed, τm, and by knowing how many amino acids are in a polypeptide chain of mass m it is possible to derive an estimate for the translation rate. There are uncertainties associated with doing this that are minimized by performing this for different protein masses, m, and calculating a regression line over all the values obtained. For a full understanding of the method, the reader will benefit from the original study by Young & Bremer, Biochem. J., 160:185, 1976. It remains as a reliable value for E. coli translation rate to this day. We are not aware of newer methods that give better results.
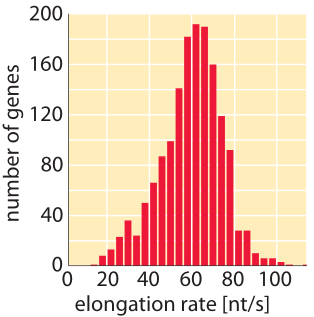
Figure 5: Distribution of measured transcription elongation rates inferred from relieving transcription inhibition and sequencing all transcripts at later time points. (Adapted from G. Fuchs et al., Genome Bio., 15:5, 2014.)
What are the corresponding rates in eukaryotes? As shown in Tables 1 and 2, transcription in mammalian cells consists of elongation at rates similar to those measured in E. coli (50-100 nt/sec, BNID 105566, 105113, 100662). It is suggested that these stretches of rapid transcription are interspersed with pauses leading to an average rate that is about an order of magnitude slower (≈6 nt/sec, 100661), but some reports do not observe such slowing down (BNID 105565). Recent in-vivo measurements in fly embryos have provided a beautiful real-time picture of the transcription process by using fluorescence to watch the first appearance of mRNA as shown in Figure 4. Recently another approach utilizing the power of sequencing inferred the distribution of transcription elongation rates in a HeLa cell line as shown in Figure 5, showing a range of 30-100 nts/s with a median rate of 60 nts/s (BNID 111027). Remember that in eukaryotes, transcription and translation are spatially segregated, with transcription taking place in the nucleus and translation in the cytoplasm. Introns are excised from transcripts prior to translation taking about 5-10 minutes on average for this process of mRNA splicing (BNID 105568). Though our focus here was on transcript elongation, in some cases the rate limiting process seems to be the initiation of transcription. This is the process in which the RNA polymerase complex is assembled, and the two DNA strands are separated to form a bubble that enables transcription.
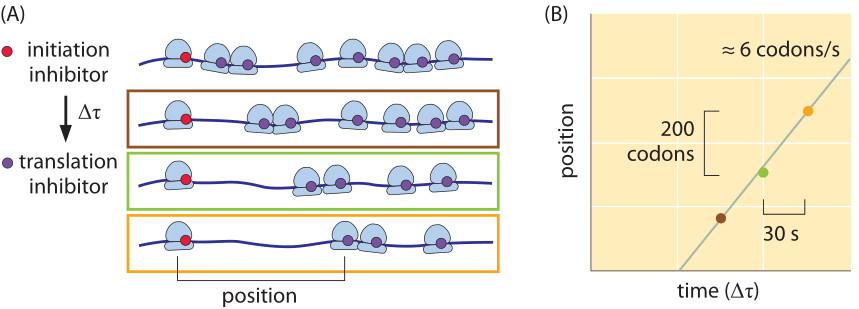
Figure 6: Inferring the rate of translation by the ribosome in mouse embryonic stem cells using ribosome profiling. (A) Inhibiting translation initiation followed by inhibition of elongation creates a pattern of ribosome stalling dependent on the time differences and rates of translation. Using modern sequencing techniques this can be quantified genome wide and the translation rate accurately measured for each transcript. (B) Measurement of the translation rate using the methodology indicated schematically in part (A). (Adapted from N. Ingolia et al., Cell, 146:789, 2011.
What about the rates of translation in eukaryotes? In budding yeast the rate is about 2 fold slower than that in bacteria (3-10 aa/s, BNID 107871), but one should note that the “physiological” temperature at which it is measured is 30ºC whereas for E. coli, measurements are at 37ºC. As discussed in the vignette on “How does temperature affect rates and affinities?”, the slower rate is what one would expect based on the general dependence of a factor of 2-3 per 10ºC (Q10 value, BNID 100919). Using the method of ribosome profiling based on high-throughput sequencing and schematically depicted in Figure 6, the translation rate in mouse embryonic stem cells was surveyed for many different transcripts. It was found that the rate is quite constant across proteins and is about 6 amino acids per second (BNID 107952). After several decades of intense investigation and ever more elaborate techniques at our disposal we seem to have arrived at the point where the quantitative description of the different steps of the central dogma can be integrated to reveal its intricate temporal dependencies.