What is the density of cells?
The density of biological material is responsible for the settling of cells to the bottom of our laboratory tubes and multi-well plates and serves as the basis of the routine centrifuging that is part of the daily life of so many biologists. These very same differences in density between cells and their watery exterior are also the basis of the contrast we observe in phase microscopy images. These differences are also important outside the lab setting. For example, plankton have to contend with this density difference to remain at a depth in the ocean where sunlight is plentiful rather than sinking to the blackened depths. Given that most biologists and biochemists make use of separation based on density on a daily basis it seems surprising how rarely densities such as those collected in Table 1 are actually discussed.
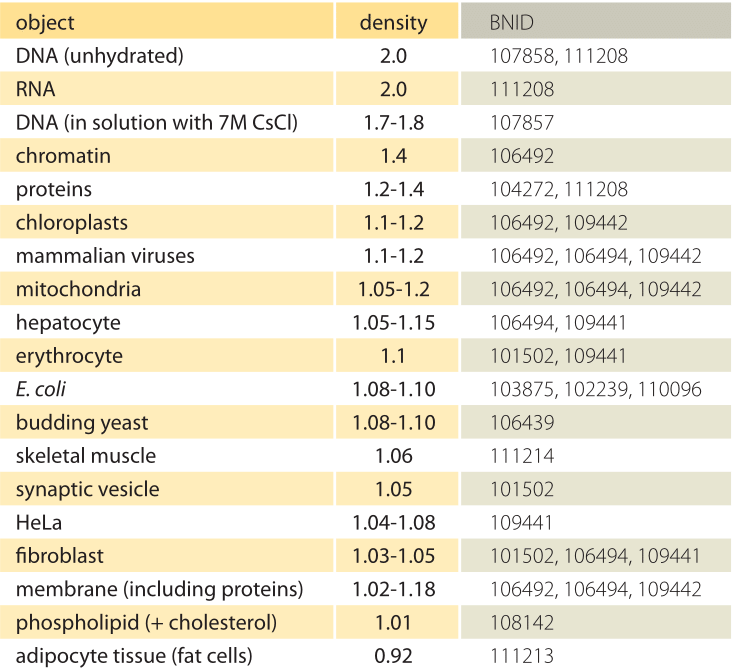
Table 1: Densities of biological objects relative to water. This is almost equivalent to giving them in units of g/ml or 1000 kg/m3. Values are sorted in descending order. Unless otherwise stated, values were measured in sucrose or ficoll solution.
What is the underlying basis for the varying densities of different organelles and cell types? To a large extent these differences can be attributed to the ratio between water content and dry mass. Proteins have a density of ≈1.3-1.4 (BNID 104272, 101502) relative to water (or almost equivalently in units of g/ml or 1000 kg/m3). Given the benchmark value of 1 for the density of water, a spectrum of intermediate values for the cell density between 1 and 1.3 are obtained based on the relative abundance of proteins and water. Lipids are at the low end next to water at a density of about 1 (BNID 108142). At the other extreme, starch granules with a density of ≈1.5 (BNID 103206) and nucleotides at ≈1.7 can shift the overall mass balance in the opposite direction.
Knowing the density is often based on the location at which a given biological component settles when spun in a centrifuge containing a gradient of concentrations often produced by sucrose or in the case of DNA, cesium chloride. The density reflects the mass divided by the volume, but for charged compounds in solution the density is also affected by shells of so called bound water. The density in this case becomes an effective density, reduced by the bound water, and thus somewhat dependent on the salt concentration (BNID 107858).
The rate of sedimentation, as occurs in a centrifuge, is quantified in units of Svedberg which is the origin of the names 70S, 23S etc. for the ribosome and its rRNA subunits. A 23S rRNA will sediment at a velocity of 23×10-12 m/s under normal gravity. In an ultracentrifuge producing an acceleration of one million g the velocity will proportionally scale to 23×10-6 m/s or about 1 mm/min. The rate of sedimentation depends on the density, size and shape of the molecule. For similar shapes and densities the sedimentation rate scales as the square root of the molecular mass. For such cases the molecular mass goes as the square of the sedimentation rate, such that the 23S and 16S subunits of the ribosome have a molecular mass with a ratio of roughly (23/16)2 or about 2 which is closely inline with measurements of 0.9 and 0.5 MDa respectively (BNID 110972, 110967). In the clinic, the sedimentation rate of erythrocytes (red blood cells) is routinely used to measure inflammation. Rates much higher than 10 mm/hour usually indicate the presence of the pro-sedimentation factor fibrinogen that is a general indicator of an inflammatory condition.
It is well known that water is the most abundant molecular fraction of cells, but how abundant exactly? If we examine tissues from multicellular organisms, finding the water content is a simple task of measuring the mass of the tissue before and after drying. But how can one perform such measurements for cells? When we weigh a mass of cells before and after drying how do we measure only the cells without any water around them? Even after centrifugation there is water left in the cell pellet resulting in ambiguity about the dry mass itself.
Once again radio-isotopic labeling comes to the rescue (Cayley et al 1991). First, labeled water (using tritium, 3H) is measured in a cell pellet. This indicates the sum of water inside and outside the cells. Then, another soluble compound that is labeled but that cannot enter the cell, such as 14C-inulin or 3H-PEG, measures the volume of water outside the cells in a centrifuged pellet (for example, in E. coli about 25-35% of the pellet volume (BNID)). The difference indicates the water content inside cells. Such methods lead to typical values ranging from ≈60-65% by mass for budding yeast and red blood cells to ≈70% for E. coli and the amoeba D. discoideum and up to ≈80% for rat muscle and pig heart tissues (BNID 105938, 103689). Since the dry matter contribution is dominated by constituents of density ≈1.3 (i.e. proteins), this leads to the characteristic overall density of ≈1.1 (BNID 103875, 106439, 101502). From these characteristic fractions the dry mass per volume can be inferred to be about 300-500 mg/ml (BNID 108131, 108135, 108136), but during slow growth values can be higher. Low densities are common in dry seeds and underwater plants that have buoyant parts with densities of less than the surrounding water, thus allowing them to float. Densities lower than that of water can be achieved either by gas as in kelp and some bacteria or by using solutes of molecular weight (MW) lower than the surrounding media (e.g. replacing sodium with MW≈23 with ammonium with MW≈18) as in the small crustaceans, Antarctic copepods.
Humans are made of about 60% water (40% in cells, 15% in interstitial fluid and 5% in blood plasma, BNID 110743) and most of us have experienced the strong effects of dehydration after forgetting to drink even just a few glasses. Yet, some cells can be surprisingly robust to a decrease in their water content. For example the rate of glucose metabolism in rat liver cells was not affected by 25% loss of intracellular water. Such a decrease can be attained by osmosis – changing the tonicity (solute concentration) of the extracellular fluid. An extreme example is that of the remarkable brine shrimp. Living in environments where the outside salt concentration can fluctuate and be very high, it was shown to have cysts that can be desiccated to only 2% water without irreversible damage and at hydration levels of higher than 37% (only about half of its fully hydrated state) their physiology behaves as normal. This robustness in the face of water loss might be related to a distinction sometimes made between two forms of water in the cell interior. Normal “bulk water” which are more dispensable and “bound water“ which is associated with the cellular components and serves as a solvent that is essential for proper functioning.