What is the macromolecular composition of the cell?
Molecular biology aims to explain cellular processes in terms of the individual molecular players, resulting in starring roles for certain specific proteins, RNAs and lipids. By way of contrast, a more holistic view of the whole cell or organism was historically the purview of physiology. Recently the latter integrative view has been adopted by systems biology, which completes the circle by returning with the hard-won mechanistic knowledge from molecular biology to a holistic view of the molecular interlinkages that give rise to whole-cell behavior. A critical starting point for thinking globally about the cell is to understand the relative abundance of its different constituents.
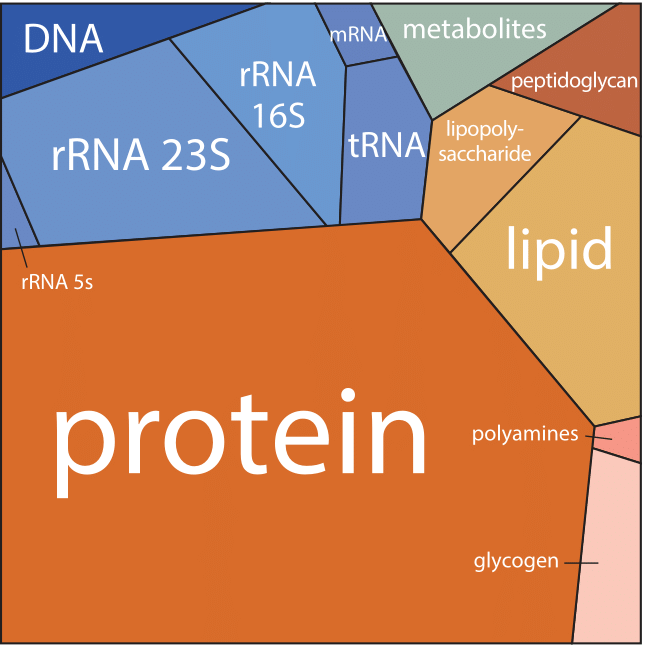
Figure 1: A Voronoi tree diagram of the composition of an E. coli cell growing with a doubling time of 40 min. Each polygon area represents the relative fraction of the corresponding constituent in the cell dry mass. Colors are associated with each polygon such that components with related functional role have similar tints. The Voronoi tree diagram visualization method was developed in order to represent whole genome measurements from microarrays or proteome quantitation.
Such a bird’s eye view of the composition of the cell is given in Figure 1 for the case of E. coli during exponential growth with a doubling time of 40 minutes. Part of the figure is dominated by the usual suspects, with proteins making up just over half of the cellular content. More surprisingly, despite their critical role as gatekeepers of gene expression, mRNAs constitute only a small fraction when analyzed in terms of absolute mass, comprising only about 1% of the dry mass. The figure is based on a compilation of information determined for the cell composition of an E. coli recreated in Table 1 (BNID 104954). This compilation first appeared in the classic textbook “Physiology of the Bacterial Cell”, a prime example of a biological text that shows the constructive obsession with numeracy that characterized the early days of bacterial physiology. Protein is evaluated at ≈55% of the cell dry weight, followed by RNA at ≈20%, Lipid at ≈10% and DNA at ≈3% (the rest being polysaccharides, metabolites, ions etc.). Similar efforts in budding yeast revealed that proteins constitute in the range of 40-50% of the cell dry mass, RNA ≈10%, and lipid ≈10% (BNID 111209, 108196, 108198, 108199, 108200, 102327, 102328). In mammalian cells the fraction taken by RNA decreases to about 4% while the fraction of lipids increases (BNID 111209).
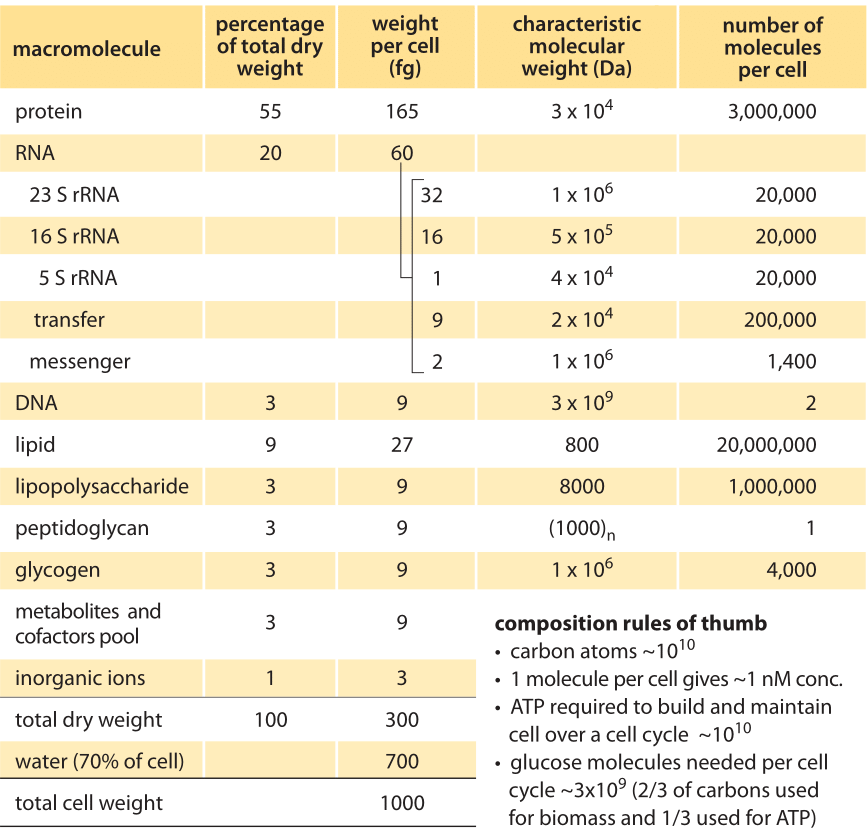
Table 1. Overall macromolecular composition of an average E. coli cell in aerobic balanced growth at 37°C in glucose minimal medium, with doubling time of 40 minutes and 1 pg cell wet weight (≈0.9 μm^3 cell volume). Adapted with modifications from F. C. Neidhardt et al., “Physiology of the bacterial cell”, Sinauer, 1990 (BNID 104954). Modifications included increasing cell dry weight from 284 fg to 300 fg and total cell mass from 950 to 1000 fg as well as rounding other values to decrease the number of significant digits such that values reflect expected uncertainties ranges. Under different growth rates the volume and mass per cell can change several fold. The relative composition changes with growth rate but not as significantly. For a given cell volume and growth rate, the uncertainty in most properties is expected to be on the order of 10-30% standard deviation. Original values refer to B/r strain, but to within the uncertainty expected, the values reported here are considered characteristic of most common E. coli strains. Data sources can be found at BNID 111490. An independent source for slower growth rates can be found at BNID 111460.
What is the logic behind these values? rRNA for example, even though quite monotonous in terms of its diversity comprises 2/3 of the ribosome mass and given the requirements for constant protein synthesis, must be abundant. rRNA is actually more than an order of magnitude more abundant than all mRNA combined. At the same time, mRNA is rapidly degraded with a characteristic half-life of about 4 minutes (BNID 104324) versus the very stable rRNA that shows degradation (in vitro) only after several days (BNID 108023, 108024). Because of the fast degradation of mRNA the overall synthesis of mRNA required by the cell is not so small and amounts to about one half of the rRNA synthesis (at 40 minutes doubling time, BNID 100060). As another example for rationalizing the cell composition, the protein content, which is the dominant constituent, is suggested to be limited by crowding effects. Crowding more proteins per cytoplasm unit volume would hamper processes such as diffusion, which is already about ten fold slower inside the cell than in pure water. We discuss such effects in the vignette on “What are the time scales for diffusion in cells?”. The average protein concentration in the cytoplasm is already such that the average protein has a water hydration shell of only ≈10 water molecules separating it from the adjacent protein hydration shell.
The amount of lipid in a “typical cell” can be deduced directly from the surface area of the membrane, though for eukaryotes, the many internal membranes associated with organelles need to be included in the estimate. Let’s see how such an estimate works for the spherocylindrical, cigar-shaped, E. coli. At a diameter of ≈1 µm and for a characteristic growth rate where the overall length is ≈2 µm (1 µm cylinder and two half spherical caps of 1µm diameter each) the surface area is an elegant A=2π or ≈6 µm2. The volume is also a neat geometrical exercise that results in V=5π/12, or ≈1.3 µm3 (though we often will choose to discuss it as having a 1 µm 3 volume for simplicity where order of magnitude estimations are concerned). As discussed in the vignette on “What is the thickness of the cell membrane?“, the lipid bilayer is about 4 nm thick (while larger values often mentioned might stem from elements sticking out of the membrane). The volume of the membrane is thus about 6 µm2*4*10-3 µm =0.024 µm3. At ≈70% water and ≈30% dry mass of density ≈1.3 (BNID 104272) the overall density is ≈1.1 (BNID) and the dry mass has a volume of about 1.3 µm3*1.1 g/cm3*0.3/1.3 g/cm3≈0.33 µm3. So the lipid bilayer occupies a fraction of about 7% of the dry mass. There are two lipid bilayers, the outer membrane and the cell membrane and thus we should double this value to ≈14%. Noting that proteins decorating the membrane occupy between a quarter and half of its area (BNID 105818) we are reasonably close to the empirically measured value of ≈9%.
How does the composition change for different growth conditions and in various organisms? Given that the classic composition for E. coli was attained already in the ‘60s and ‘70s and that today we regularly read about quantitation of thousands of proteins and mRNA we might have expected the experimental response to this question to be a standard exercise. The methods for protein quantification are mostly variants of that developed by Lowry in 1951. The paper announcing these methods which, after the first submission had been returned for drastic cuts by the journal, apparently became the most highly cited paper in the history of science with more than 200,000 citations. For all their virtues and citations, the methods in that work tend to be limited in their accuracy when applied to the full complement of cells, often turning into finicky biochemical ordeals. For example, other cell constituents such as glutathione, the main redox balancer of the cell, may influence the reading. As a result, comprehensive characterization of the cellular census for different conditions is mostly lacking. This situation limits our ability to get a true physiological or systems view of the dynamic cell and awaits revisiting by biologists merging good experimental hands with a quantitative bent.