What is the mutation rate during genome replication?
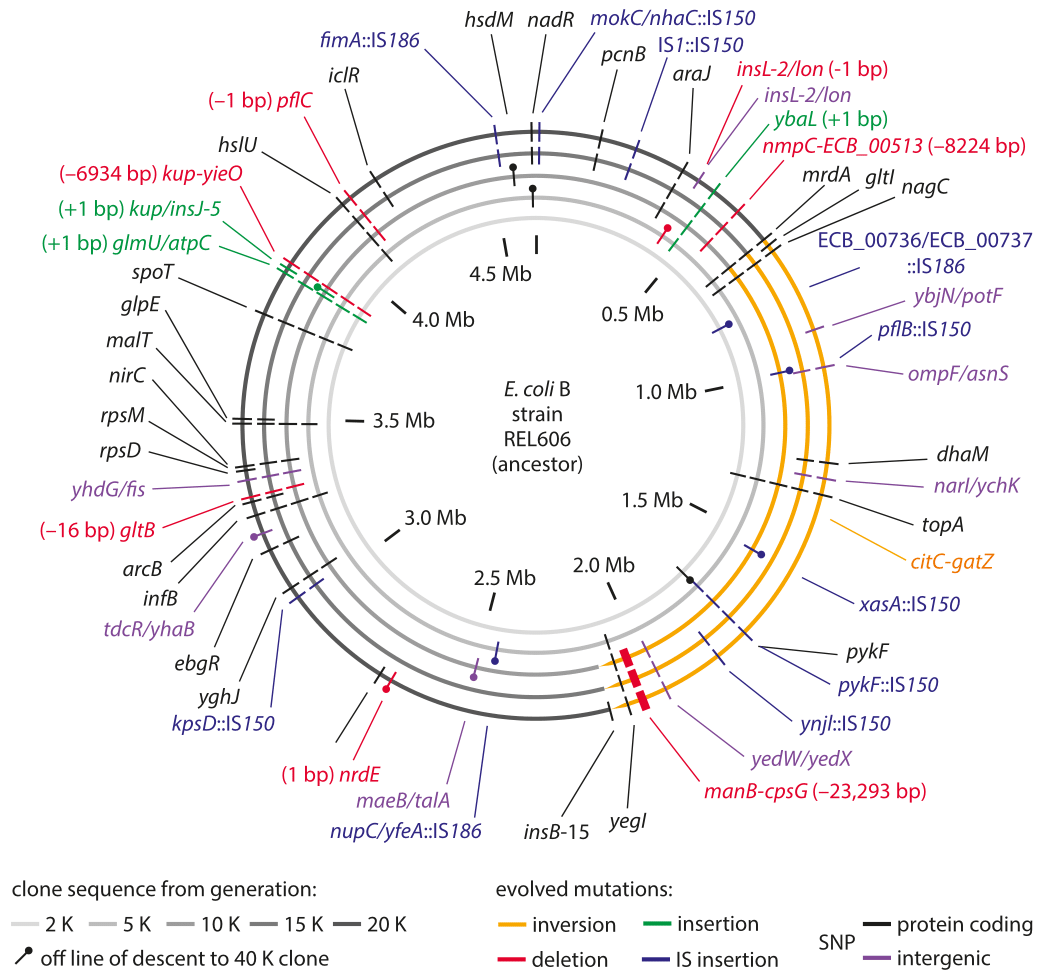
Figure 1: Sequencing measurements of fixed mutations over 20,000 generations in E. coli. Because of this long-term experiment, it is possible to compare the full genome sequence at different times to the reference sequence for the genome at the time the experiment started. The labels in the outer ring show the specific mutations that were present after 20,000 generations. Adapted from J. E. Barrick et al. Nature, 461:1243, 2009.
The genomic era has ushered in the ability to read out mutation rates directly. It replaced older methods of inference that were based on indirect evolutionary comparisons or studies of mutations that are visually remarkable such as those resulting in color changes of an organism or changes in pathogenic outcomes. A landmark effort at chasing down mutations in bacteria is a long-term experiment in evolution that has been running for more than two decades in the group of Richard Lenski. In this case it is possible to query the genome directly through sequencing at different time points in the evolutionary process and to examine both where these mutations occur as shown in Figure 1 as well as how they accumulate with time as shown in Figure 2. Sequencing of 19 whole genomes detected 25 synonymous mutation (indicating neutral rather than selective changes) that got fixed in the 40,000 generations of the experiment. This measurement enabled the inference that the mutation rate is about 10-10 mutations per bp per replication in the measured conditions (BNID 111229).
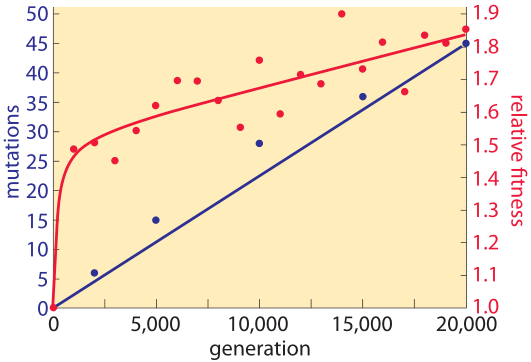
Figure 2: Mutation accumulation and fitness over time. Sequencing measurements make it possible to examine the rate of mutation accumulation and the corresponding fitness over time. Adapted from J. E. Barrick et al. Nature, 461:1243, 2009.
What are the implications of an E. coli mutation rate on the order of 10-10 mutations/bp/replication ? Given a genome size of 5×10⁶, this mutation rate leads to about one mutation per 1000 generations anywhere throughout the genome. At the same time, because an overnight culture test tube often contains over 109 bacterial cells per ml one finds that every possible single-base-pair mutation is present as worked out in Figure 3. Mutation rates vary with the environmental conditions and become higher under stressful conditions such as those prevailing in stationary phase. A collection of mutation rates in a range of organisms is provided in Table 1.
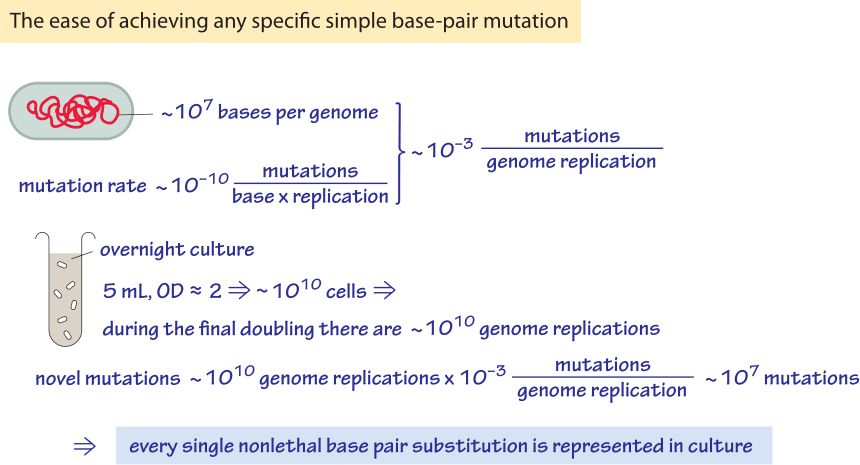
Figure 3: Back of the envelope calculation of the mutations in an overnight culture of bacteria. One finds that every possible base pair change in explored.
In humans, a mutation rate of about 10-8 mutations/bp/generation (BNID 105813) was inferred from projects where both parents and their children were sequenced at high coverage. Note that the value of the mutation rate is on a per generation basis and is thus the accumulation in the gametes of mutations occurring over several tens of genome replications between fertilization of the egg all the way until the formation of the next generation of gametes. The characteristic number of such replications is discussed in the vignette on “How many chromosome replications occur per generation?”. In humans it is estimated that there are about 20-30 genome replications between the fertilized egg and the female gametes (BNID 105585) and about ten times that for males, with large variation depending on age (BNID 105574). With ≈3×10⁹ bp in the human genome the mutation rate leads to about 10-8 mutations/bp/generation x 3×10⁹ bp/genome ≈ 10-100 mutations per genome per generation (BNID 110293). Using an order of magnitude of 100 replications per generation, we arrive at 0.1-1 mutations per genome per replication. Though we discuss mutations on a per replication or per generation rate, non-dividing cells will also have damage caused to their genomes through mechanisms such as radiation and reactive oxygen species. When the damage is corrected, mutations accumulate with time at rates that are still not well constrained experimentally. Yet it is clear that with the aid of the sequencing revolution we will soon know much more.
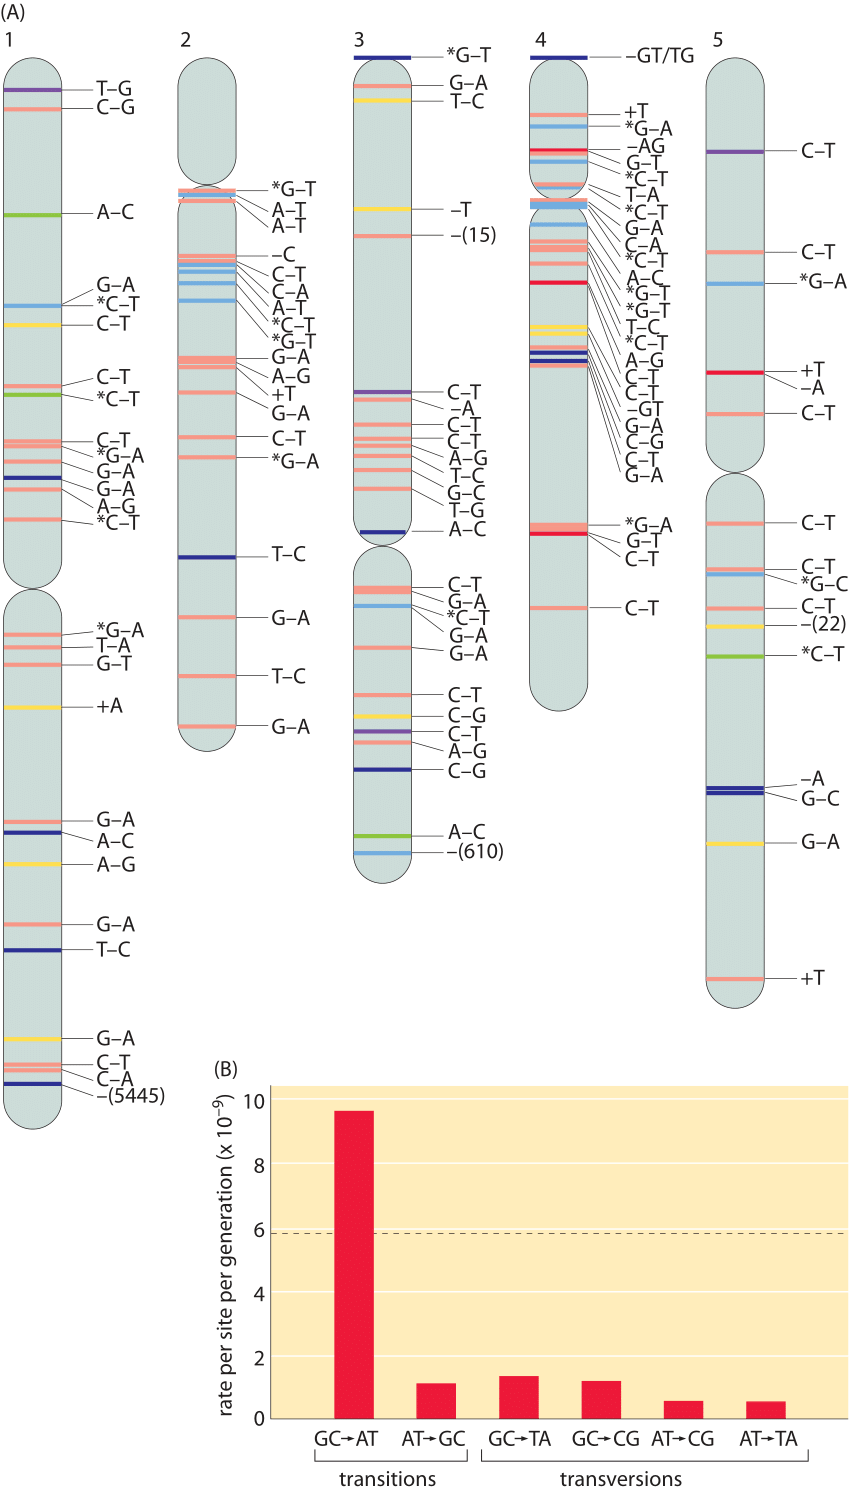
Figure 4: (A), Spontaneous mutations across the A. thaliana chromosomes after 30 generations (single seed dependents). Color definitions: red, intergenic region; yellow, intron; dark blue, nonsynonymous substitution, shift of reading frame for short indels, or gene deletion for large deletions; green, synonymous substitution; purple, UTR; and light blue, transposable element. + and – refer to insertions and deletions respectively. Asterisk denotes methylated cytosine. (B), The rate of mutations varies across different base pairs. Mutation rates are shown per site per generation. The overall mutation rate, which is the average of the total mutation rates at A:T and G:C sites, and its standard error in gray are shown in the background. The total mutation rate sums for example for the base pair A:T the rates of change to C:G, G:C and T:A. Adapted from S. Ossowski et al. Science, 327:92, 2009.
The numbers for humans can be compared to the mutation rates in the model plant Arabidopsis thaliana where a similar study was undertaken. Five plants derived from 30 generations of single-seed descent were sequenced and compared. The full complement of observed mutations is shown in Figure 4A. The spontaneous single base pair mutation rate was found to be roughly 7×10⁻⁹ per bp per generation. Given that there are an estimated 30 replications per generation (see vignette on “How many chromosome replications occur per generation?”) this leads to about 2×10⁻¹⁰ mutations per bp per replication. Note that there are many different classes of point mutations that can be categorized as a result of such sequencing experiments, giving a picture of whether the mutations are synonymous or non-synonymous and whether the mutation event is a transition or transversion. Different mutations are not evenly distributed as we show in Figure 4B. They are dominated by a G-C base pair being transformed into an A-T based pair. This arises due to the biochemical susceptibility of the nucleotides to being mutated. Another common type of mutation in the genome are insertion and deletion events, so called indels. With the same approach as that outlined above the rates of 1-3 bp insertions and deletion were estimated to be an order of magnitude less abundant than single base pair substitutions at 0.6×10⁻⁹ and 0.3×10⁻⁹ per bp per generation, respectively. Deletions larger than 3 bp occur at a frequency of 0.5±0.2×10⁻⁹ per site per generation, and remove on average 800±1900 bp per event (110372, note that the distribution is so wide that the standard deviation is larger than the mean. This can occur due to many small deletions and some very large deletions). Beyond these often discussed forms of genome alteration through mutation, genomes show surprising dynamism as revealed by other forms of genome rearrangement such as the “jumping genes” discovered by Barbara McClintock, many of which still defy even rudimentary quantification.
Given the existence of these various mechanisms of genome rearrangement, it is interesting to consider the extent to which the space of possible genomic mutations is explored. A recurring class of estimates in various contexts, such as the famed Levinthal paradox, center on how well biological systems “explore” the space of all possible outcomes. In many of these examples (protein folding, space of possible genomes, etc.), the astronomical numbers of possible outcomes are simply staggering. As a result, it is easy to wonder how thoroughly the space of possible mutations is “searched” within the human population. We explore how such an estimate might go in Figure 5. Given that there are about 7 billion people on earth, with on the order of ≈10 mutations per generation, we estimate that the current human occupants of the planet explore roughly 7×109x10 ≈ 1011 new mutations during the turnover from one generation to the next. This means that if we focus our attention on any single site within the 3 billion base pair human genome, dozens of humans harbor a mutation in that particular site. As a result, the space of single base pair mutations is fully explored amongst the entire population of humans on earth. On the other hand, if we consider a specific two base pair mutation we find that by random mutation it would require on the order of 107 generations of the human population to achieve it by chance!
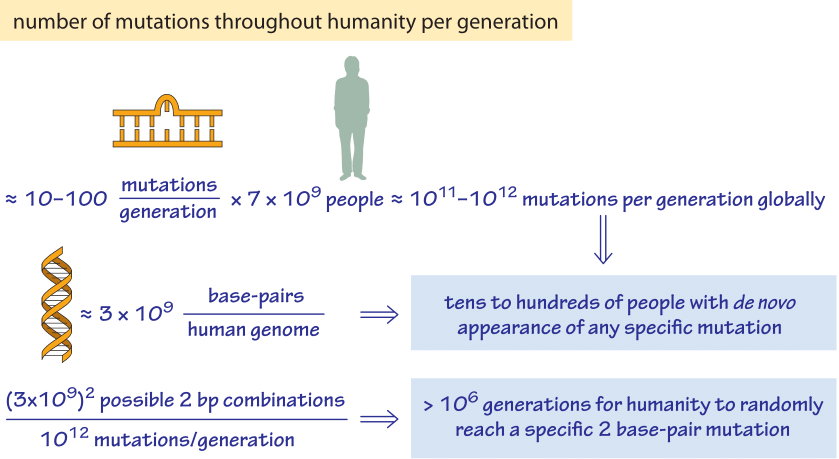
Figure 5: Back of the envelope calculation of the number of mutations throughout humanity per generation. We find that each single base pair mutation is explored dozens of times in every generation but that a specific combination of two base pairs will require an unrealistic number of generations to occur at random. A fitness advantage or some contingency mechanism is required to achieve these concerted changes.
Figure 1: Sequencing measurements of fixed mutations over 20,000 generations in E. coli. Because of this long-term experiment, it is possible to compare the full genome sequence at different times to the reference sequence for the genome at the time the experiment started. The labels in the outer ring show the specific mutations that were present after 20,000 generations. Adapted from J. E. Barrick et al. Nature, 461:1243, 2009.