What is the permeability of the cell membrane?
One of the signature characteristics of all living organisms is that they contain a distinctive mixture of ions and small molecules. The composition not only differs from the environment but can also vary within the cell. For example, the concentration of hydrogen ions in some cellular compartments can be 104 times greater than in others (the mitochondria reaching a pH as high as 8; the lysosomes with a pH as low as 4, BNID 107521, 106074). The ratio of the concentrations of Ca2+ ions in the extra- and intracellular fluid compartments can once again be 104-fold (BNID 104083). This concentration difference is so large that transporting a Ca2+ ion across the membrane, from the intra- to the extracellular compartment, requires the energy of more than one proton or sodium ion flowing down the proton-motive force gradient. To see this, the reader should remember the rule of thumb from our tricks of the trade list that to establish an order of magnitude potential difference requires 6 kJ/mol (≈2 kBT). This energy can be attained for example by transport of one electric charge through a 60 mV potential difference. To achieve four orders of magnitude concentration ratio would then require a charge to travel down about 240 mV of electron motive force (actually even more due to the double charge of the calcium ion). This is very close to the breakdown voltage of the membrane as discussed in the vignette on “What is the electric potential difference across membranes?”. Indeed the high concentration ratio of Ca2+ is usually achieved by coupling to the transport of three sodium ions or the hydrolysis of ATP, which helps achieve the required density difference without dangerously energizing the membrane.
The second law of thermodynamics teaches us that, in general, the presence of concentration gradients will eventually be bled off by mass transport processes, which steadily drive systems to a state of equilibrium. However, although the second law of thermodynamics tells us the nature of the ultimate state of a system (e.g. uniform concentrations), it doesn’t tell us how long it will take to achieve that state. Membranes have evolved to form a very effective barrier to the spontaneous transfer of many ionic and molecular species. To estimate the time scale for equalizing concentrations, we need to know the rates of mass transport, which depend upon key material properties such as diffusion constants and permeabilities.
A hugely successful class of “laws”, which describe the behavior of systems that have suffered some small departure from equilibrium are the linear transport laws. These laws posit a simple linear relation between the rate of transport of some quantity of interest and the associated driving force. For mass transport, there is a linear relation between the flux (i.e. the number of molecules crossing unit area per unit time) and the concentration difference (which serves as the relevant driving force). For transport across membranes, these ideas have been codified in the simple equation (for neutral solute) j= – p·(cin-cout), where j is the net flux into the cell, cin and cout refer to the concentrations on the inside and outside of the membrane bound region, and p is a material parameter known as the permeability. The units of p can be deduced by noting that flux has units of number/(area x time) and the concentration has units of number/volume, implying that the units of p itself are length/time. Like many transport quantities (e.g. electrical conductivities of materials which span over 30 orders of magnitude), the permeability has a very large dynamic range as illustrated in Figure 1. As seen in the figure, lipid bilayers have a nearly 1010-fold range of permeabilities.
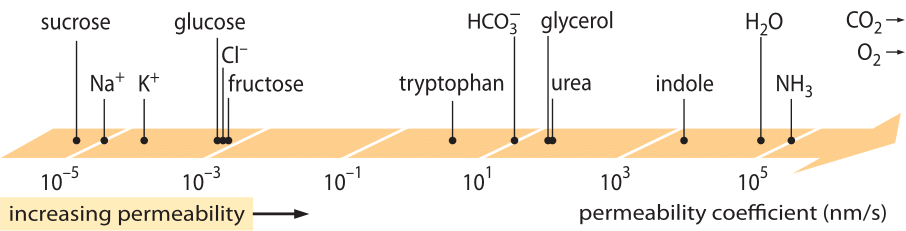
Figure 1: The wide range of membrane permeabilities of different compounds in the cell. Membranes are more permeable to uncharged compounds and least permeable to charged ions. Note that the existence of ion channels will make the apparent permeability when they are open several orders of magnitude higher. The units are chosen as nm/s and several nm is the characteristic membrane width. Figure adapted from R. N. Robertson, The Lively Membranes, Cambridge University Press, 1983. The value for glucose is smaller than in Robertson based on several sources such as BNID 110830, 110807. Other sources of data: BNID 110729, 110731, 110816, 110824, 110806.
What physico-chemical parameters guide the location of a compound on this scale of permeabilities? One rule of thumb is that small molecules have higher permeabilities than larger molecules. Another rule of thumb is that neutral compounds can cross the membrane many orders of magnitude faster than similar charged compounds. Among the charged compounds, negative (anionic) compounds tend to have much higher permeabilities than positive (cationic) compounds. The so called Overton rule states that membrane permeability increases with hydrophobicity, where hydrophobicity is the tendency of a compound to prefer a non-polar solvent to a polar (aqueous) solvent. The Overton rule predicts that charged molecules (non-hydrophobic), such as ions will tend to have low permeability as they incur an energetic penalty associated with penetrating the membrane, whereas dissolved gases such as O2 and CO2, which are hydrophobic (as they are uncharged and symmetric), will have high permeability. Indeed, the permeability of lipid bilayer membranes to CO2 give values that are 0.01-1 cm/s (yes, permeability measurements have very high uncertainties among different labs, BNID 110004, 110617, 102624), higher than all other values shown in Figure 1. This value shows that the barrier created by the cell membrane is actually less of an obstacle than the barrier caused by the unstirred layer of water engulfing the cell membrane from the outside. Such an inference can be derived by the equation for the permeability coefficient of an obstacle, given by p=K x D/l where l is the width, D the diffusion coefficient and K the partition coefficient between the media and the obstacle material. This is also known as the “solubility-diffusion” model for permeability where these denote the K and the D effects which are two steps affecting the permeability. For an unstirred layer of water K=1 as it is very similar to the media but for membrane the value for all but the most hydrophobic material is usually several orders of magnitude smaller than 1. This dependence on K is at the heart of the Overton rule mentioned above. The high permeability for CO2 also suggests that channels such as aquaporins that were suggested to serve for gas transport into the cell are not required as the membrane is permeable enough. To see how the membrane properties affect the chemical makeup of metabolites we turn to calculating the time of leakage for different compounds
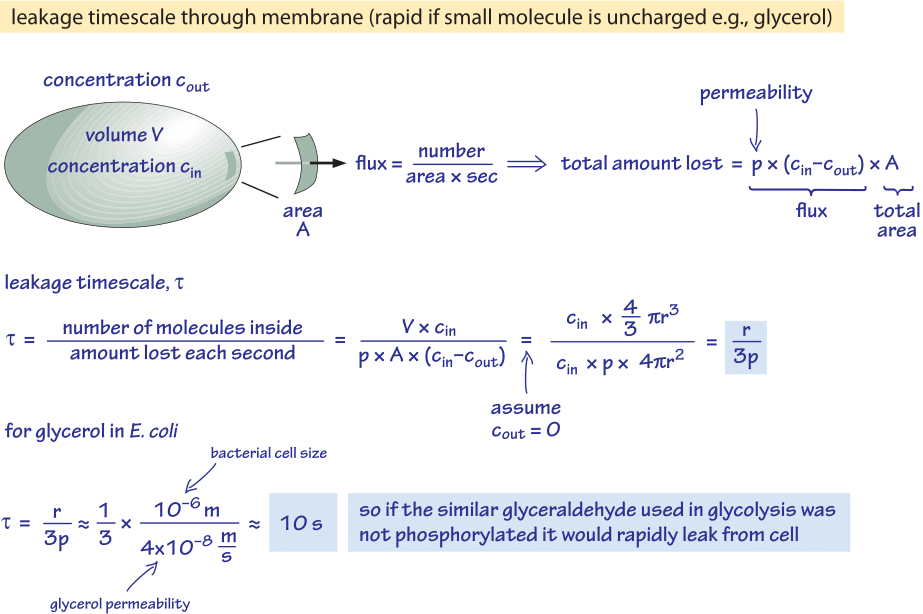
Figure 2: Back of the envelope calculation of the timescale for unphosphorylated glucose molecule to passively diffuse out of a bacterial cell. The functional implications are then considered for fast growing cell where the effect is negligible and for cells in stationary state where it may cause an appreciable leakage of resources.
We consider glycerol, for example. The analysis shown in Figure 2 gives an estimate for the time of its leakage out of the cell if the molecule is not phosphorylated or otherwise converted into a more hydrophilic form. The permeability of the cell membrane to glycerol is p≈10-100 nm/s (BNID 110824) as can be read from Figure 1. The time scale for a glycerol molecule inside the cell to escape back to the surrounding medium, assuming no return flow into the cell (cout=0), can be crudely estimated by noting that the efflux from the cell is p·A·cin where A is the cell surface area. The time scale is found by taking the total amount in the cell, V·cin (where V is cell volume or more accurately the cell water volume), and dividing by this flux resulting for a bacterial cell (r≈1 μm) in a time scale:
t =V·cin/p·A·cin =(4πr3/3)/(4πr2·3×10-6 cm/s) ≈ 10 s.
This is a crude estimate because we did not account for the decreasing concentration of cin with time that will give a correction factor of 1/ln(2), i.e less than 2 fold increase. What we learn from these estimates is that if the glycolytic intermediates glyceraldehyde or dihydroxyacetone which are very similar to glycerol were not phosphorylated, resulting in the addition of a charge, they would be lost to the medium by diffusion through the cell membrane. In lab media, where a carbon source is supplied in abundance, this is not a major issue, but in a natural environment where cells are often waiting in stationary phase for a lucky pulse of nutrients (E. coli is believed to go through months of no growth after its excretion from the body before it finds a new host), the cell can curb its losses by making sure metabolic intermediates are tagged with a charge that will keep them from recrossing the barrier presented by the lipid bilayer.