What is the pH of a cell?
Hydrogen ions play a central role in the lives of cells. For example, changes in hydrogen ion concentration are intimately tied to the charge of side chains in proteins. This charge state, in turn, affects the activity of enzymes as well as their folding and even localization. Further, the famed ATP synthases that churn out the ATPs that power many cellular processes are driven by gradients in hydrogen ions across membranes.
The abundance of these ions and, as a result, the charge state of many compounds is encapsulated in the pH defined as
pH=-log10([H+]/1)
where [ ] denotes the concentration or more formally the activity of the charged hydrogen ions (H+, or more accurately the sum of hydronium, H3O+, as well as the functionally important but often overlooked Zundel, H5O2+, and Eigen, H7O3+, cations). We are careful to divide the hydrogen ion concentration by a so-called “standard state” concentration, the agreed upon value is 1M, in order to ensure that when taking the log we have a unitless quantity. This step is often skipped in textbooks.
The integer 7 is often etched in our memory from school as the pH of water, but there is nothing special about the integral value of 7. Water has a neutral pH of about 7, with the exact value varying with temperature, ionic strength and pressure. What is the pH inside the cell? Just like with other parameters describing the “state” of molecules and cells, the answer depends on physiological conditions and which compartment within the cell we are considering (i.e. which organelle). Despite these provisos, crude generalizations about the pH can be a useful guide to our thinking.
An E. coli cell has a cytoplasmic pH of ≈7.2-7.8 (BNID 106518) measured as discussed below. This pH value is a result of both active and passive mechanisms required for the ability of E. coli to colonize the human gastrointestinal tract that contains niches of pH ranging from 4.5 to 9 (BNID 106518). A passive mechanism for maintaining this pH relies on what is termed the buffering capacity of the cell. The buffering capacity is defined as the amount of a strong acid needed to decrease the pH by one unit. A characteristic value for the buffering capacity of the cell interior is 10-100 mM per pH unit (BNID 110750, 110775, 107126-107130) or by our rule of thumb about 10-100 million protons need to be added per µm3. This equivalently teaches us that there are about 10-100 million ionizable groups in a cubic micron of cell material that will release a proton when the pH is decreased by one unit. This capacity is provided by the cell’s metabolite pool, that is, the fact that a change in pH will result in a release or absorption of hydronium ions which counteracts the externally induced change in pH. As shown in the vignette “What are the concentrations of free metabolites in cells?”, the main ingredients of the metabolite pool are glutamate, glutathione and free phosphates. These metabolites have concentrations in the mM range, i.e. millions of copies per bacterial volume. The pKa values, which indicate at what pH value a molecule will tend to change its protonation state and thus release or absorb a proton (equivalent to a hydronium ion), are for phosphates and glutathione not far from the neutral range of pH 7. Having the pKa in that range ensures that these metabolites will tend to counteract changes in pH. Active mechanisms for controlling the hydrogen ion concentration include the use of transporters such as ATPases that are driven by ATP hydrolysis to pump protons against their concentration gradient. These transporters are regulated such that the cell can actively involve them in order to sculpt the intracellular pH.
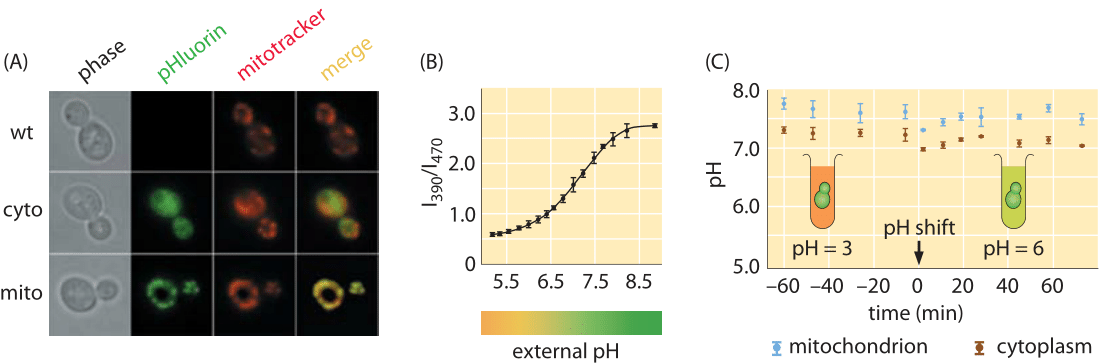
Figure 1: Measuring the pH of cells in vivo using pH sensitive fluorescent protein. (A) Microscopy images using both phase imaging and fluorescence. (B) Ratio of intensity at two different wavelengths, 390 nm and 470 nm, can be used to calibrate the pH. (C) Time course for the pH as measured using the fluorescent probe. (Adapted from R. Orij, Microbiology, 155:268, 2009.)
As a second depiction of an organism’s characteristic pH range, budding yeast is reported to have a cytoplasmic pH of ≈7 in exponential growth on glucose that decreases to about 5.5 in stationary phase (BNID 110927, 107762, 109863). As shown in Figure 1A, these measurements were carried out using more fluorescent protein tricks, this time with a pH-sensitive fluorescent protein. By examining the ratio of the light intensity emitted by this protein at two distinct wavelengths, it is possible to calibrate the pH as shown in Figure 1B. Yeast flourish when the external pH is mildly acidic as the process of transport of molecules into yeast cells is often based on co-transport with an incoming proton and is thus more favorable if the external pH is lower than the internal pH (BNID 109863). Pumping excess protons into the vacuole is a way of maintaining a cytoplasmic pH near 7, while acidifying the vacuole to a pH of ≈5.5-6.5. The same fluorescence measurements reveal that the yeast mitochondria in these conditions have a pH of 7.5. Figure 1C, shows a case where the internal pH of a yeast strain is kept almost constant under very different pH conditions of the surrounding medium. In another experiment the internal pH shows a different dynamic behavior by closely following the external pH (BNID 110912). The reasons underlying the variation in these responses are still under study. Using such pH sensitive probes in mammalian HeLa cells revealed the cytoplasm and nucleus had a pH of ≈7.3, mitochondria ≈8.0, ER ≈7.5 and Golgi ≈6.6 (BNID 105939, 105940, 105942, 105943). Tissues in animals ranging from the brain to muscles to the heart have a pH in the range 6.5-7.5 (BNID 110768, 110769, 110770, 110771).
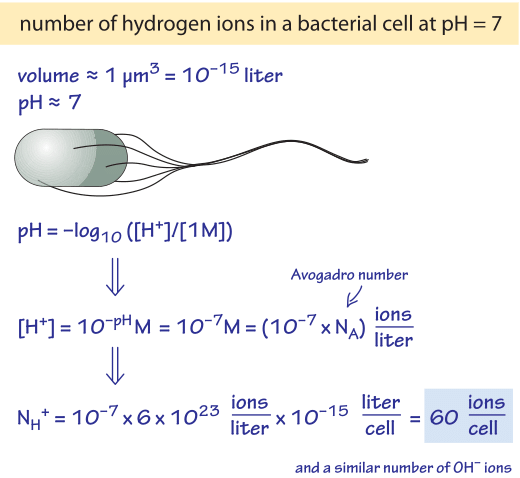
Figure 2: Back of the envelope calculation of the number of hydrogen ions in a typical bacterial cell volume.
Even though hydrogen ions appear to be ubiquitous in the exercises sections of textbooks, their actual abundance inside cells is extremely small. To see this, consider how many ions are in a bacterium or mitochondrion of volume 1 µm3 at pH 7 (BNID 107271, 107272). Using the rule of thumb that 1 nM corresponds to ≈1 molecule per bacterial cell volume, and recognizing that pH of 7 corresponds to a concentration of 10-7 M (or 100 nM), this means that there are about 100 hydrogen ions per bacterial cell at the typical pHs found in such cells, as worked out in more detail in the calculation shown in Figure 2. This should be contrasted with the fact that there are in excess of a million proteins in that same cellular volume, each one containing several ionizable groups each of which has a pKa close to 7 and thus the tendency to gain or release a hydrogen ion.
How can so many reactions involving hydronium ions work with so few ions in the cell? To answer that question, we need to think about how long it takes an active site to find a charge required for a reaction? It is important to note two key facts: (i) cells have a strong buffering capacity as a result of metabolites and amino acid side chains and (ii) the hopping time of charges between different water molecules is very short in comparison with the reaction times of interest.
If the 100 hydrogen ions we have estimated are present in each cell were all used up to alter the charge state of macromolecules, the pH still does not change significantly as there are literally millions of groups in proteins and metabolites such as ATP that will compensate by releasing ions as soon as the pH begins to change. Hence, these 100 ions are quickly replenished whenever they are consumed in reactions. This implies that there are orders of magnitude more ion utilizing reactions that can take place. This capability is quantified by the cell’s buffering capacity. But how does a reaction “find” the hydronium ion to react with if they are so scarce? The lifetime of a hydronium ion is extremely brief, about 1 picosecond (10-12, BNID 106548). Lifetime in this context refers to the “hopping” timescale when the charge will move to another adjacent water molecule (also called the Grotthuss mechanism). The overall effective diffusion rate is very high ≈7000 µm2/s (BNID 106702), a value that should be contrasted with the much lower diffusion rates for most biological molecules. The lifetime and diffusion values can be interpreted to mean that for every ion present in the cell, on average, 1012 water molecules become charged very briefly every second. In an E. coli cell there are about 1011 water molecules. Thus every single ion “visits” every molecule 10 times a second and for 100 ions per cell every molecule will be converted to an ion 103 times per second, even if very briefly in each such case. As a result, an enzyme or reaction that requires such an ion will find plenty of them in the surrounding water assuming the kinetics is fast enough to allow utilization before the ions neutralize to be formed somewhere else in the cell.
The scale of the challenge of keeping a relatively constant pH can be appreciated by thinking of the dynamic pools of metabolites inside a cell. Think of glucose being catabolized in glycolysis. In this process, internal electron rearrangements known as substrate-level phosphorylation, convert non-charged groups into a carboxyl acid group (COOH–). This conversion releases a hydrogen ion in metabolites of the process, each having a concentration in the mM range. A 1 mM increase in concentration of such an intermediate releases about 106 protons per cell. This number of protons would cause the pH of the cell to drop to 3 (!) if not for the buffering capacity discussed above as well as concurrent changes in metabolites concentrations. This is but one example that illustrates the powerful and tightly regulated chemistry of hydrogen ions inside the cell.