What is the power consumption of a cell?
Cells are out-of-equilibrium structures and require a constant supply of energy to remain in that privileged state. Measuring how much power is required to run a cell or the heat produced as it goes through its normal metabolic operations is experimentally challenging. Beyond the challenges associated with actually measuring cellular power consumption, there are several plausible definitions for a cell’s rate of energy usage, making a rigorous discussion of the problem even more demanding. We will explain the meaning and relevance of some of these definitions and then use estimates and reported measurements to explore their order-of-magnitude values. We don’t aim for high precision as these values can easily vary by more than an order of magnitude depending upon what growth medium is used, the growth rate and other environmental factors.
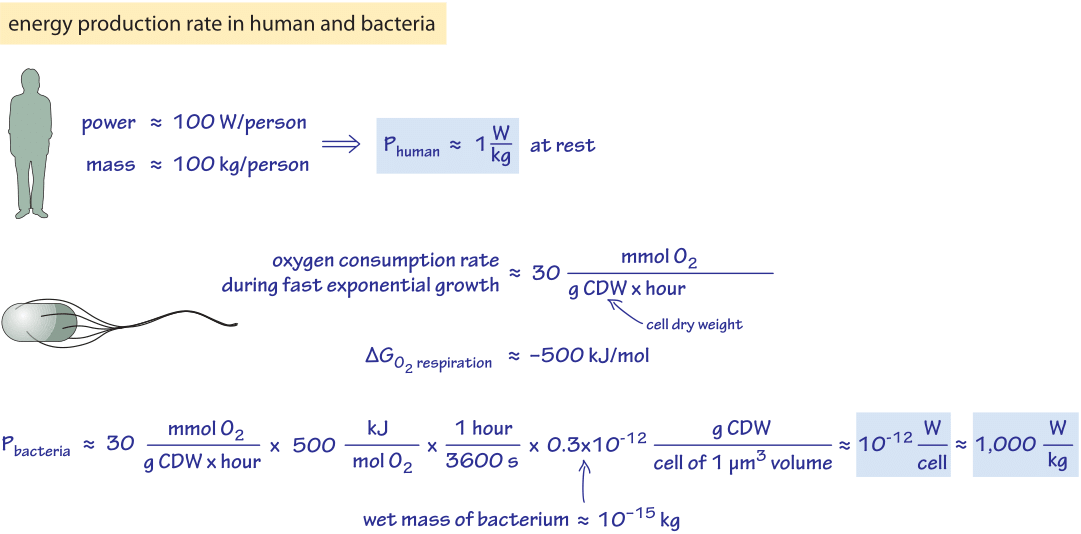
Figure 1: Back of the envelope calculation estimating the rate of energy production in a human and a bacterial cell
For our first estimate, we consider the rule of thumb that an adult human produces heat at a rate of about 100 W (recall that 100 watts=100 J/s,) similar to a bright incandescent light bulb which is borne out by noticing how warm a room becomes as more people are packed in. The 100 W value was calculated on the basis of a caloric intake of 2000 kcal per day in the vignette on “What is the free energy released upon combustion of sugar?”. Assuming a person has a mass of ≈100 kg (let’s forget about our recent post-holiday diet for the moment – this is an order of magnitude estimate) we find a power consumption of about 1 W/kg as depicted in Figure 1. This value is about 10-15 W/μm3, where we revert to that useful unit of volume, remembering that a bacterium has a volume of roughly 1 μm3, a red blood cell has a volume of roughly 100 μm3 and an adherent mammalian cell has a volume in the range of 1,000-10,000 μm3. The definition of power consumption used here is based on the rate of heat production. We consider other definitions below.
Recent measurements of glucose consumption in primary human fibroblasts make it possible to consider a second estimate for human energy consumption. Quiescent human fibroblasts of unreported volume were found to consume about 1 mmol glucose per gram of protein per hour (BNID 111474). We recall that the total energy released by glucose combustion (where carbon from sugar is merged with oxygen to yield CO2 and water) is about 3000 kJ/mol as discussed in the vignette on “What is the free energy released upon combustion of sugar?”. The protein content of a characteristic 3000 µm3 cell volume is about 300 pg corresponding to 3×10⁹ cells per gram of protein. One cell thus requires
(3×10⁶ J/mol glucose) x (10-3 mol glucose/(g protein x hour) x (1 hour/3600 sec) x (1 g protein/3×109 cell) = 3×10⁻¹⁰ W/cell.
On a mass basis this is equivalent to 3×10⁻¹⁰ W/cell x 3×10¹¹ cells/kg ≈ 100 W/kg of cell wet weight which is two orders of magnitude higher than our estimate based on whole-human-body analysis. Perhaps fibroblasts are more metabolically active than the average human cell. Alternatively, this two order of magnitude discrepancy might call into question the accuracy of the reported values. It is hard to tell without more data. Though we are perplexed by this result, it nicely focuses our attention on a concrete scientific question about the energy consumption of fibroblasts grown in the lab versus the “average” cell in the human body, and motivates future experiments and measurements.
It is sometime more useful to think in ATP units of energy. We can assume ≈20 ATPs produced per glucose molecule in a combination of respiration and fermentation characteristic of cancerous cells (BNID 111475). We then find that the consumption worked out above translates to about 109 ATP/s/mammalian cell of 3000 µm3 volume (BNID 111476). What is knowing this value good for?
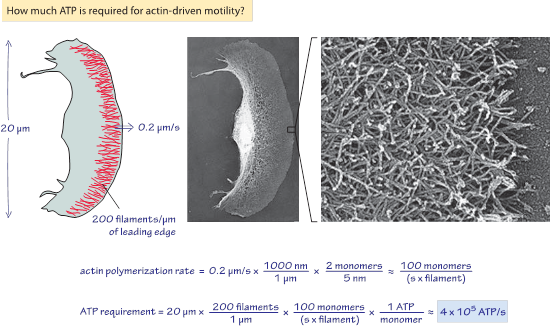
Figure 2: Back of the envelope calculation of the ATP demand for motility of a cell. Actin filaments crisscross the leading edge of a motile keratocyte and their dynamic polymerization results in a net forward motion with a speed of 0.2 µm/s. (Electron micrographs adapted from T. M. Svitkina et al., J. Cell Biol. 139:397, 1997.)
Let’s think about cell motility. When we watch videos of keratocytes dragging themselves quickly across the microscope field of view on their lamellipodium as shown in Figure 2, it is natural to assume that these processes require a large fraction of the energy available to these cells. But is that really the case? For many eukaryotic cells, motility is driven primarily by dynamic actin polymerization at a steady state cost of about 1 ATP hydrolysis per polymerizing actin monomer. Labeling actin fluorescently famously showed that actin filaments in moving goldfish epithelial keratocytes polymerize at the same rate that the cell moves, about 0.2 µm/s at room temperature as depicted in Figure 2 (BNID 111060). Given the actin monomer size, each filament must grow by about 100 monomers/s to support motility, which costs ≈100 ATP per polymerizing filament per second. But how many actin filaments are required to move a cell? As shown in Figure 2, the leading edge of a goldfish keratocyte lamellipodium is about 20 µm long and contains roughly 200 actin filaments per micron of length (BNID 111061), or ≈4000 filaments in total. If actin polymerizes primarily at the leading edge of the lamellipodium, the keratocyte must burn about 4000×100 = 4×10⁵ ATP/s to power its movement. In light of the ATP consumption of a cell calculated above this value turns out to be a very minor ATP requirement of less than a tenth of a percent. Having made the effort to calculate these energetic costs we’ve refined our understanding of the energy budget of cells.
How do the results described above for humans compare to what we can say about energy consumption in bacteria? An empirical approach is based on keeping track of the rate of oxygen consumption of the cells (which depends of course on carbon source and growth conditions). For growth on minimal media with glucose, a characteristic value for the oxygen consumption rate is 30 mmol O2/g dry cell weight/hour (BNID 109687). Performing the necessary unit conversions, noting that oxygen respiration releases 500 kJ/mol O2 of heat as discussed in the vignette on “What is the free energy released upon combustion of sugar?”, we find as shown in Figure 1, 10-12 W/cell=1,000 W/kg. We conclude that under these reference conditions, bacterial consumption of energy per unit biomass is about three orders of magnitude higher than that of a human. A reader curious about similar trends across different organisms and efforts to rationalize them is invited to visit the next vignette on “How does metabolic rate scale with size?”. Similarly, to see how this compares to the energetic requirements of bacterial motility, consult the vignette on “What is the frequency of rotary molecular motors?”.
We next analyze rapid bacterial growth in terms of ATP usage. We make use as done above of the oxygen requirement of 30 mmol O2/hour/g dry weight during growth on glucose and now utilize this figure through the so called P/O ratio, which is the ratio of ATP produced per oxygen atom respired (equal to about 2, i.e. 3-5 ATP per 1 O2 molecule, BNID 111461, 110656, 110628). We thus arrive at about 100 mmol ATP/hour/g dry weight, which translates into ~107 ATP/s/bacterial cell. Throughout a cell cycle taking about an hour this leads to 1010-1011 ATP per bacterial cell of 1 µm3 volume produced. Noting that one hour is also a characteristic doubling time in which each cell produces a new cell of about 1010 carbon atoms (BNID 103010) we have a rule of thumb of about 1 ATP per 1 carbon incorporated into biomass during cell growth. How are these numbers useful? Consider the idea of powering an E. coli cell using bacterial proteorhodopsin, a membrane protein that sits in the cell membrane of some types of bacteria and pumps protons when exposed to light (discussed in J. M. Walter, et al., Proc. Nat. Acad. Sci. 104:2408, 2007). One can imagine packing on the order of 105 such proteins on the available real estate of a “standard” bacterial membrane (but actual values tend to be much lower, BNID 111296). We can infer that in order to divide once every few hours (say 104 s), as expected of bacteria, each of these membrane proteins will have to pump a proton several hundred times per second (at least ~1011 protons needed from 105 proteins per 104 s). These protons will then be used to power the machines that synthesize ATP. If these proteins cannot maintain such a transport rate, or packing such a large number of proteins on the membrane is not possible, powering the cell metabolism is a no go from the start (BNID 111295).
What processes are fueled by all of this energy consumption in cells? Efforts in the 1970’s tried to perform “ATP accounting” for bacterial cells – to list all the processes in cells according to how much ATP they consume. Of the processes that could be clearly quantified (including metabolism and polymerization) protein synthesis from amino acids dominated the budget at fast growth rate and preferred carbon sources. The polymerization of an amino acid into a nascent peptide chain consumes about 4 ATP/amino acid and with 2-4 million proteins per µm3 and 300 aa per protein we are led to about 4×10⁹ ATPs spent per µm3 of cell volume. This should be compared to the value of 1010-1011 in the previous paragraph. We conclude that this is a major energy drain, but more surprising is that a large fraction, amounting to about half of the measured energy used (BNID 102605), is not accounted for by any process essential for cell buildup and was generally regarded as lost in the membrane associated processes of membrane potential buildup and leakage. Revisiting these abandoned efforts at cellular accounting is of great interest for example, determining the fraction lost by metabolic futile cycles and by posttranslational protein phosphorylation and dephosphorylations.
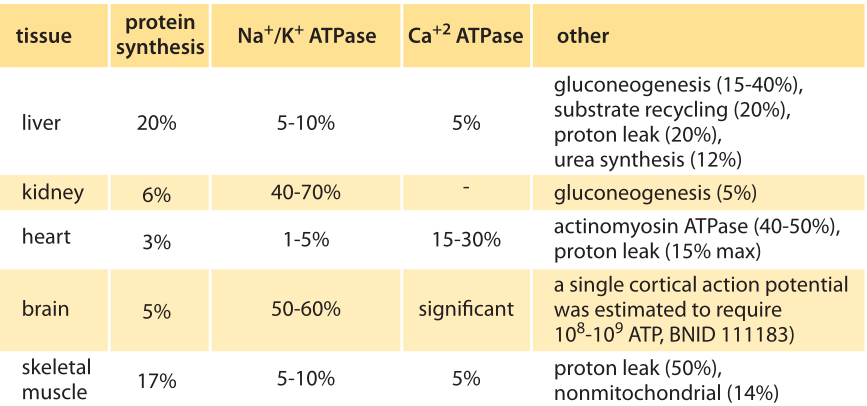
Table 1: Distribution of major oxygen-consuming processes to total oxygen consumption rate of rate tissues in standard state (BNID 107962). Values are rounded to one significant digit. Adapted from: Cellular Energy Utilization and Molecular Origin of Standard Metabolic Rate in Mammals. Rolfe & Brown, Physiological reviews, 1997.
Trying to perform similar accounting for mammalian cells, the answer again depends on the growth conditions, relevant tissue etc. In Table 1 (BNID 107962) we reproduce the findings for mouse tissues showing major contributions from protein synthesis, the Na+/K+ ATPase (the machine in charge of maintaining the resting electric potential in cells), actinomyosin ATPase (that drives muscle cells) and mitochondrial proton leakage. In neurons it was estimated that actin turnover is responsible for about 50% of the ATP usage (BNID 110642). New bioluminescent probes enable measuring the ATP concentration in neurons in vivo and connect them to synaptic activity. Such methods promise to give us a new ability for detailed energy censuses in the coming years.
We end by noting that in extreme environments such as the permafrost of Antarctica, bacteria were found to be viable at depths of 3000 m below ground at temperatures well below zero degrees Celsius. Due to impurities, the water does not freeze and the metabolic rate is extremely slow, ≈6 orders of magnitude smaller than under rapid growth (BNID 111454, 111455). This has been termed survival metabolism where cells are dormant and the energy is thought to be used to repair macromolecule damage.