What is the rate of recombination?
In his autobiography, Darwin mused with regret at his failure to learn more mathematics, observing that those with an understanding of the “great leading principles of mathematics” “seem to have an extra sense”. This extra sense is beautifully exemplified in a subject that was near to Darwin’s heart, namely, the origins of heredity, the study of which gave rise to modern genetics. Gregor Mendel was intrigued by the same question that has perplexed naturalists as well as parents for countless generations, namely, what are the rules governing the similarities and differences of parents and their offspring? His approach required the painstaking and meticulous act of counting frequencies of various traits such as pea shape from carefully constructed plant crosses, where he found that out of a total of 7,324 garden peas, 5,474 of them were round and 1,850 were wrinkled. The subsequent analysis of the data showed for this case a ratio of these traits in the second generation of crosses of 2.96 to 1, providing a critical clue permitting Mendel to posit the existence of the abstract particles of inheritance we now call genes.
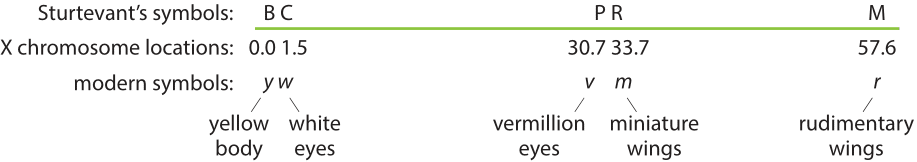
Figure 1: Schematic of the first genetic map of the X chromosome of Drosophila redrawn with modern symbols. Sturtevant’s map included five genes on the X chromosome of Drosophila. Adapted from: http://www.nature.com/scitable/topicpage/thomas-hunt-morgan-genetic-recombination-and-gene-496. Locations updated from Green & Piergentili, PNAS 2000. Based on: Pierce, Benjamin. Genetics: A Conceptual Approach, 2nd ed. (New York: W. H. Freeman and Company), 161. From:
To cause a sea change in biological research required going beyond phenomenological observations to a situation where genetic manipulations could be more easily performed and more detailed predictions made. This came about when Morgan, head of a lab already overflowing with studies of pigeons and starfish, undertook with his students an object of study with minimal space requirements and faster generation times. So came to the scene one of the great protagonists of modern genetics, the fruit fly Drosophila Melanogaster. As Morgan’s lab transformed to what became known as the “fly room” (first at Columbia University, then at Caltech), it harbored flies with several distinct morphological properties akin to Mendel’s mottled and different colored peas. Systematic crosses of these mutant flies showed deviations from the predictions of Mendelian genetics on the relative fractions of different progeny. An inquisitive Columbia University undergraduate student in Morgan’s lab decided to analyze the frequencies of linkage, that is of pairs of co-inherited traits. During a long night that was supposed to be devoted to homework for his undergrad studies, the young Alfred Sturtevant instead made a conceptual leap that was to become textbook material and a cherished story from the history of science. He found that the tendency of the traits they studied to be inherited together such as white eyes instead of red eyes or a more yellow body color could be quantitatively explained if one assumes that the genes for these traits are ordered along a line (chromosome) and the tendency not to be inherited together is then reasonably predicted as increasing linearly with their distance. Using this logic, that night Sturtevant created the first genetic map reproduced in Figure 1.
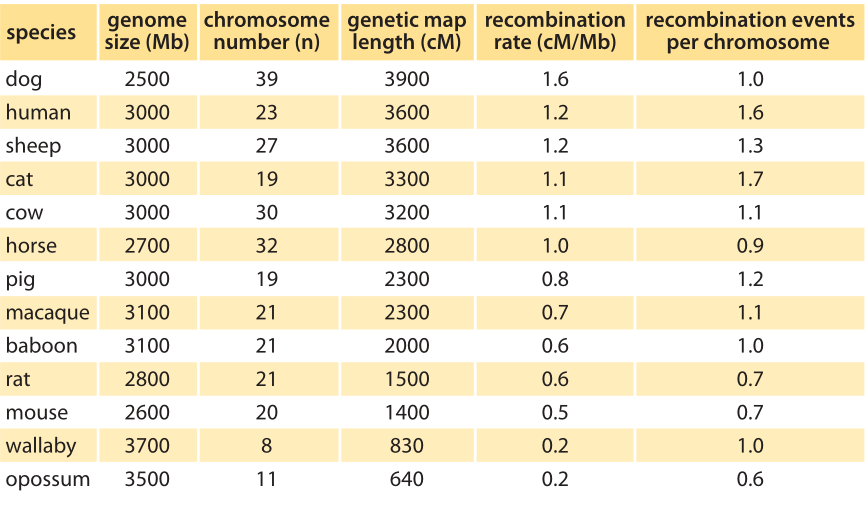
Table 1: Recombination rates in various mammals and marsupials of similar genome sizes. Genetic map length is the sum of genetic map lengths summing in units of cM over all chromosomes in each genome. The right most column, recombination events per chromosome, is calculated by dividing the genetic map length (cM/100) by the number of chromosomes. Note how this genetic map length per chromosome is close to one over the range of organisms. (BNID 107023, adapted from Dumont BL, Payseur BA. Evolution of the genomic rate of recombination in mammals. Evolution. 62:276, 2008. Choromosme numbers are from: http://www.genomesize.com.)
The mechanism explaining the frequency with which characteristics are inherited together is that of recombination. This is an act of two chromosomes of similar composition coming together and performing a molecular crossover, thereby exchanging genetic content. Two genes on the chromosome that have a 1% chance of crossover per generation are defined to be at a distance of one centimorgan, or cM for short. In humans, the average rate of recombination is about 1cM per 1Mbp (BNID 107023), that is, for every million base pairs there is a one in a hundred chance of crossover on average per generation. The variation in the rate of recombination is shown in Table 1. It tends to scale inversely with genomic length. This interesting scaling property can be simply understood by noting that in most species there are one to two crossover events per chromosome per replication. This results in an organism-wide rule of thumb of one recombination event per chromosome as demonstrated in the right-most column of Table 1, or equivalently as 100 cM (i.e. one Morgan or one crossover) per chromosome per replication. Beyond general rules of thumb, we now also know that some locations along chromosomes are hotspots that are more labile for crossovers. Finally, human females have ≈50% higher recombination rates than males (42 versus 28 on average in one recent study, BNID 109268). So even though you tend to get more of your single base mutations from your father as discussed in the vignette on “How many chromosome replications occur per generation?”, your crossovers are mostly thanks to your mother.
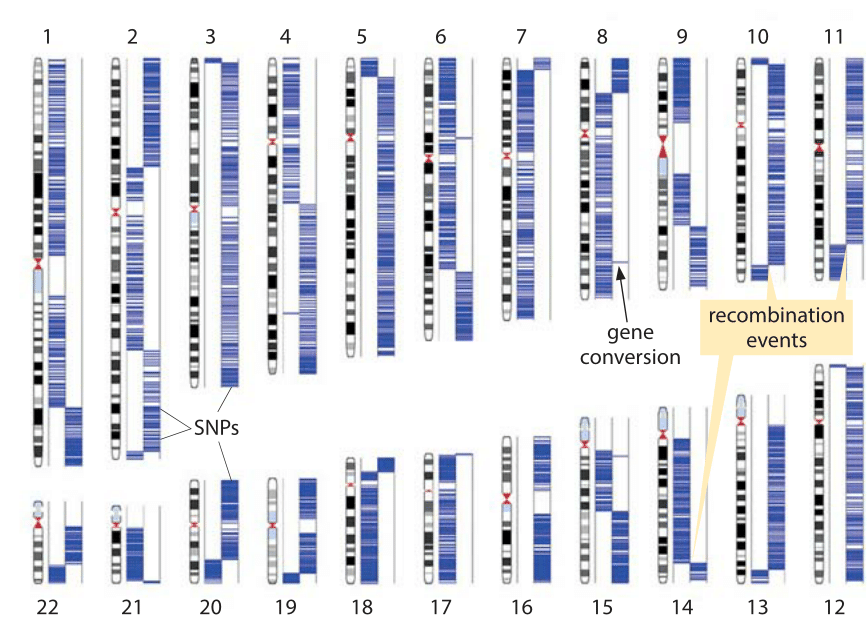
Figure 2: Detection of recombination events based on sequencing of a single sperm cell. The two columns in each chromosome represent the two homologous chromosomes carried by the subject. The source of the sperm single chromosome copy can be traced to one or the other homologous chromosome based on single nucleotide polymorphisms that appear in one chromosome but not the other. Blue lines show the association of the sperm sequence to the two chromosome sets based on those single nucleotide polymorphisms. Each switch (haplotype block) indicates a recombination event. (Adapted from J. Wang, et al., Cell 150:402,2012.)
Recent breakthroughs in genotyping have made it possible to perform a single-cell analysis of recombination activity. Single nucleotide polymorphisms (SNPs) are locations in the human genome where there is variation between people such that say more than 1% of the population has a nucleotide different than the majority of the population. For the human population there are on the order of 106 such locations on the genome. Here is how this can be used to infer the number and location of recombination events. The chromosomes of a male were separated in a microfluidic device (arbitrarily marked as left and right for each of the 22 pairs) and then each chromosome was separately analyzed for the variant of nucleotide it carries by a microarray technology. The same process was repeated for a sperm cell leading to maps such as that shown in Figure 2. At the locations where it is known that there is polymorphism in the genome it was checked if the variant in the sperm cells is the one that appears in one chromosome but not the other, and if so its location was marked as a blue stripe on the relevant chromosome. The events of recombination are clearly seen as switches of those polymorphism locations from one arm to the other. On average, 23 recombination events were found for a human sperm cell (BNID 108035). Short stretches consisting of a single SNP switching chromosome, as highlighted in chromosome 8, are cases of what has been termed gene conversion where one allele (gene copy) has performed homologous recombination that makes it replace the other copy (its heterozygous allele). Such analysis at the single-cell level, in contrast to inference at the population level or from studying progeny in a family, makes it possible to see the rates of events such as recombination and mutation in the gametes including for those gametes that will not lead to viable progeny. This is relevant as the human monthly fecundity rate, that is the chance of a menstrual cycle leading to pregnancy, is only about 25% (BNID 108080) even at the peak ages of 20-30. Aberrations in the genome content are often detected naturally early in development, within the first few weeks following conception, and lead to natural termination of the pregnancy even before the woman is aware she is pregnant.
Today recombination also serves researchers as a key tool in genetic engineering for creating designer genomes. Homologous recombination enables incorporation of a DNA sequence at a prescribed location within the genome. Its use has transformed our ability to tag genes of interest and resulted in genome-wide libraries enabling high-throughput analysis of key cellular properties ranging from localization of proteins to different cellular locations to genome-wide assessments of protein levels and variability. Though recombineering, as it is called, is incredibly powerful, unfortunately it can only be used in some organisms and not others, giving those lucky organisms a strong selective pressure in labs around the world as attractive model systems. Outstanding examples are the budding yeast and the moss physcomitrella patens. The method of homologous recombination requires a sequence of homology flanking the integrated sequence. The length of this sequence varies depending on the organism, the gene of interest and the specific technique and protocol employed. Some characteristic values are ≈30-50 bp in budding yeast (BNID 101986) whereas in mouse it is ≈3-5 kbp (BNID 101987). With the longer stretches also comes a much lower efficiency of performing the act of homologous recombination complicating the lives of molecular biologists, though modern CRISPR techniques have effected a new revolution in genome editing that may largely supersede recombineering methods.