What lipids are most abundant in membranes?
Cells are separated from the external world by complex membranes that are a rich combination of lipids and proteins. The same membrane sequestration strategy that separates the interior of cells from the rest of world is also used for separating the cellular interior into a collection of membrane-bound organelles such as the nucleus, the endoplasmic reticulum, the Golgi apparatus and mitochondria. All of these membrane systems are host to a diverse collection of lipids that come in different shapes, sizes and concentrations. There are literally hundreds of distinct types of lipid molecules found in these membranes and, interestingly, their composition varies from one organelle to the next even though these distinct membrane systems are in communication through intracellular trafficking by vesicles. Even at a given moment in time, the plasma membrane is remarkably asymmetric, with different classes of lipids occupying the outer and cytosolic leaflets of the membrane, for example. The molecules making up membranes are often known for their dual relationship with the surrounding water molecules, since the hydrophilic head groups have a favorable interaction with the surrounding water while the long chain carbon tails incur a substantial free energy cost when in contact with water. This ambivalence provides a thermodynamic driving force for the formation of bilayers in which the hydrophobic tails are sequestered in the membrane interior, leaving the hydrophilic head groups exposed to the surrounding solution.
To see the functional implications of this great lipid diversity we begin by examining some common ingredients from the kitchen. Both the fats and oils (olive, soy etc.) we use to make delicious meals are made up of lipids. In general, the lipids in the fats we eat do not contain double bonds (they are termed saturated, meaning that their carbon tails have as many hydrogens bound to them as possible). This results in chain molecules that are long and straight implying that they interact strongly with each other, making them solid at room temperature. By way of contrast, lipids in oils contain double bonds (they are known as unsaturated, that is, each carbon could have partnered up with more hydrogens) that create kinks in the molecules. They are thus hindered in their ability to form ordered structures and as a result are liquid at room temperature. An analogous situation occurs in biological membranes. Muscle cells with a high concentration of lipid chains that are unsaturated (oil like) tend to be more fluid. The quantitative physiological and molecular implications of this fact are still under study.
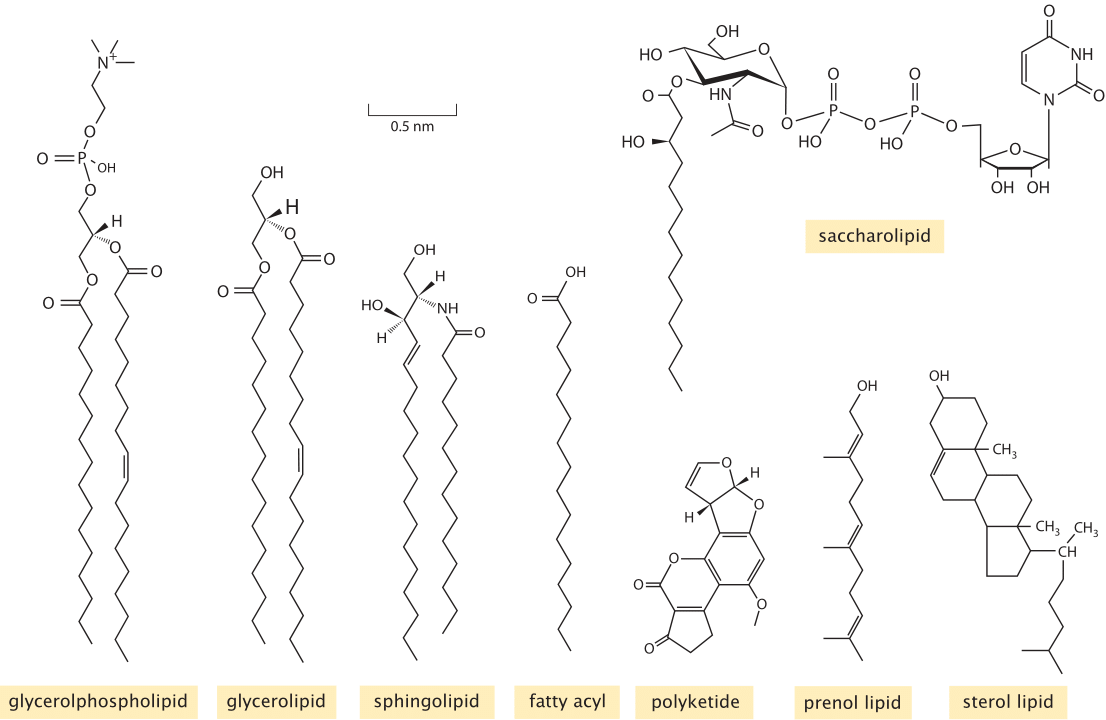
Figure 1: Diversity of membrane lipids. Structures of representatives from the key lipid types found in lipidomic surveys of biological membranes. (Adapted from E. Fahy et al., Journal of Lipid Research, 46:839, 2005.)
Experimentally, the study of lipid diversity is a thorny problem. “Sequencing” a set of single or double bonds along a carbon backbone requires very different analytic tools than sequencing nucleotides in DNA or amino acids along proteins. Still, the “omics” revolution has hit the study of lipids too. The use of careful purification methods coupled with mass spectrometry have made inroads into the lipid composition of viral membranes, synaptic vesicles, and organellar and plasma membranes from a number of different cell types. To appreciate what is being learned in “lipidomic” studies, we first need to have an impression of the classification of the different lipid types. Learned committees of experts have attempted to tame the overwhelming chemical diversity of lipids by organizing them into eight categories (fatty acyls, glycerolipids, glycerophospholipids, sphingolipids, sterol lipids, prenol lipids, saccharolipids, and polyketides). The classification criteria are based on the distinct chemistry of both the hydrophobic and hydrophilic pieces of these molecules. Figure 1 shows the chemical structure for a representative from each of these categories as found in cell membranes. Simple rules of thumb about the geometry of these molecules that we can use to instruct our intuition are that the cross sectional area of each such lipid range between roughly ¼ and ½ nm2 (BNID 106993), leading to a few million lipids per squared micron of membrane area. Their characteristic lengths are roughly 2 nm (BNID 105298) in line with the bilipid membrane being about 4-5 nm in width as discussed in the vignette on “What is the thickness of the cell membrane?”. The mass of each lipid is usually in the range 500-1000 Da (BNID 101838), somewhat larger than amino acids or nucleotides.
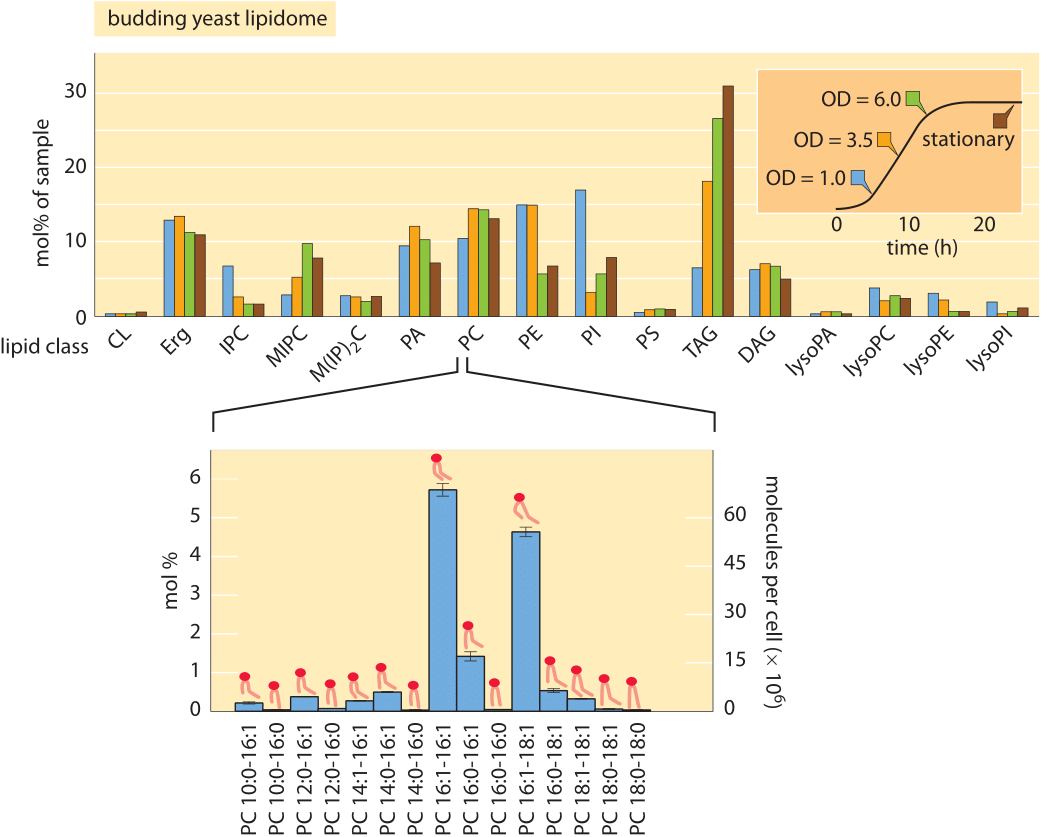
Figure 2: Lipidomic survey of budding yeast. The top figure shows the relative proportions of different lipid types as a function of the physiological state of the cells as determined by where they are along the growth curve (inset). The lower panel illustrates that for each lipid type shown in the top panel, there is an incredible diversity of chemically related lipids that differ in tail length and degree of saturation. CL: cardiolipin; Erg: Ergosterol; IPC: inositolphosphorylceramide; MIPC: mannosyl-inositol phosphorylceramide; M(IP)2C: mannosyl-di-(inositolphosphoryl) ceramide; PA: phosphatidic acid; PC: phosphatidylcholine; PE: phosphatidyl-ethanolamine; PI: phosphatidylinositol; PS: phosphatidylserine; TAG: Triacylglycerols; DAG: diacylglycerol; LPC: Lysophosphatidylcholine (Top panel adapted from C. Klose et al., PLoS One, 7:e35063, 2012; lower panel adapted from C. S. Ejsing et al., Proc. Nat. Acad. Sci., 106:2136, 2009.).
Because of the advances in lipidomic technologies, we are now at the point where it is becoming possible to routinely measure the concentrations of the array of different lipid types found in the various membranes of the cell in organisms ranging from single-celled prokaryotes all the way to the cells of our immune system. In broad brush strokes, what has been learned is that in most mammalian cells, phospholipids account for approximately 60% of total lipids by number and sphingolipids make up another ≈10%. Non-polar sterol lipids range from 0.1% to 40% depending on cell type and which subcellular compartment is under consideration. The primary tool for such measurements is the mass spectrometer. In the mass spectrometer each molecule is charged and then broken down, such that the masses of its components can be found and from that its overall structure reassembled. Such experiments make it possible to infer both the identities and the number of the different lipid molecules. Absolute quantification is based upon spiking the cellular sample with known amounts of different kinds of lipid standards. One difficulty following these kinds of experiments, is the challenge of finding a way to present the data such that it is actually revealing. In particular, in each class of lipids there is wide variety of tail lengths and bond saturations. Figure 2 shows the result of a recent detailed study of the phospholipids found in budding yeast. In Figure 2A, we see the coarse-grained distribution of lipids over the entire class of species of lipids found while Figure 2B gives a more detailed picture of the diversity even within one class of lipids. Figure 3 goes farther and gives an organelle-by-organelle accounting of the lipid distributions found in a mammalian cell.
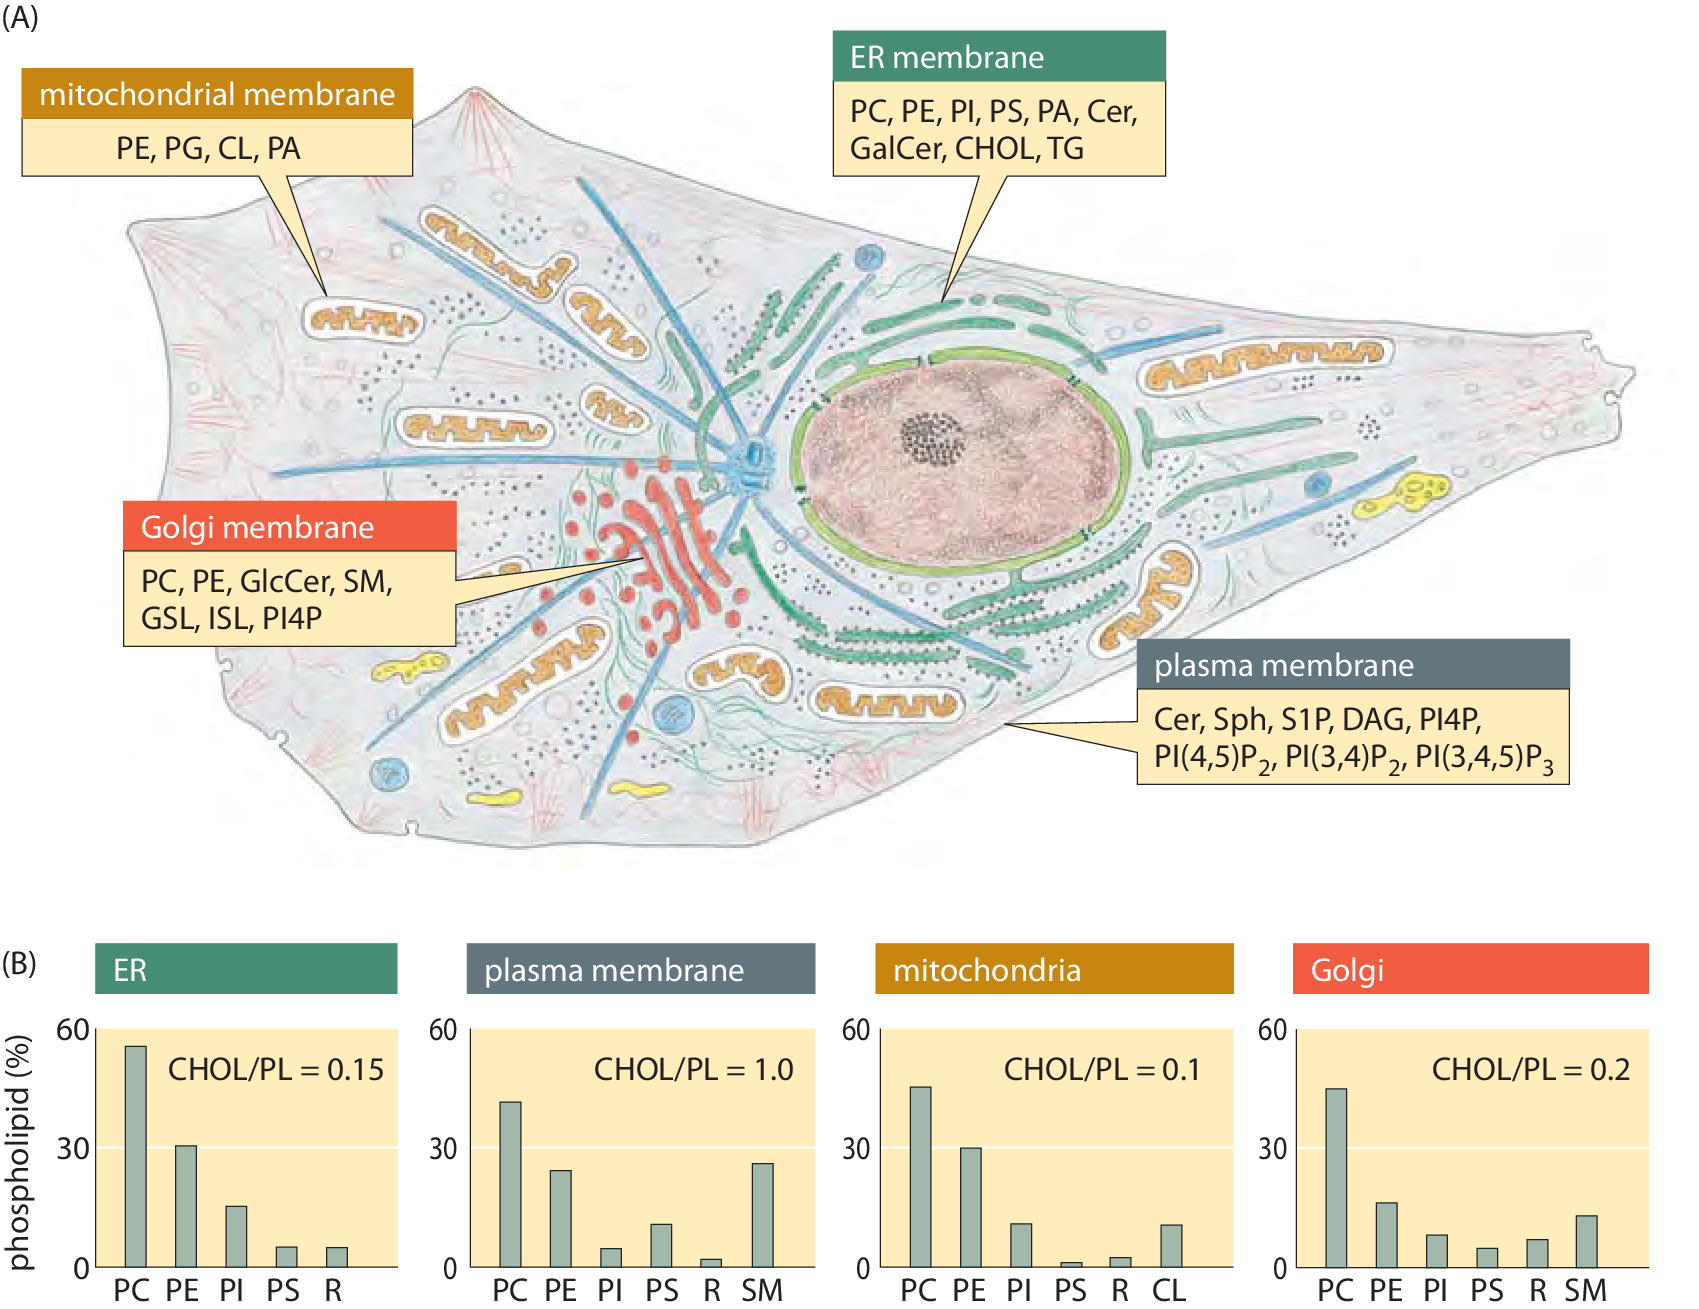
Figure 3: Lipid synthesis and steady-state composition of cell membranes. Lipid production is spread across several organelles. The top panel shows the site of synthesis for the major lipid. The main organelle for lipid biosynthesis is the endoplasmic reticulum (ER), which produces the bulk of the structural phospholipids and cholesterol. The lipid composition of different membranes also varies throughout the cell. The bottom graphs show the composition out of the total phospholipid for each membrane type in a mammalian cell. As a measure of sterol content, the molar ratio of cholesterol to phospholipid is indicated. SM: sphingomyelin; R: remaining lipids. For more detailed notation see previous figure caption (Adapted from G. van Meer et al., Nature Mol. Cell Biol., 9:112, 2008.)
With the increasing sophistication of experimental methods in lipidomics, it is now even possible to trace out the life history over time of the lipid distribution in a particular cell type. How should we think about the significance of all of this lipid diversity for the underlying biological function of the cells and organelles that harbor such diversity? One of the reasons this lipid distribution is interesting is that these different membrane systems are constantly exchanging material as a result of the active trafficking processes that take place within cells. For example, communication between the endoplasmic reticulum (ER) and the Golgi apparatus through vesicle transport means that there is a flux of lipids from one organelle to the other. Yet differences in composition are somehow maintained. Together, the composition differences between different organelles and changes in composition as cells make the transition between different character (such as the change in polarity of epithelial cells during tissue formation) illustrate the exquisite control which is exercised over lipid concentrations, belying the idea of lipids as passive bystanders in the lives of cells. A second insight that emerges from such studies is revealed in Figure 2A where we see that as a culture of yeast cells reach saturation, the distribution of lipids changes. One of the most interesting outcomes of that study on the flexibility of the yeast lipidome is the insight that triacyglycerols (TAG) increase in abundance. These lipids are important both to sustain viability during starvation and to provide raw materials for the synthesis of new fatty acids when cells resume growth.
In light of these various quantitative and factual observations into the lipid composition of different cell types, the field is now faced with the challenge of understanding how all of this molecular diversity is tied to physiological functionality. In this book we aim to give a sense of how the numbers in biology often make functional sense, in the case of lipidomics we await future research (and knowledgeable readers) to go beyond the descriptions given here.